
This presentation includes “forward-looking statements” within the meaning of the “safe harbor” provisions of the Private Securities Litigation Reform Act of 1996. The company’s actual results may differ from its expectations, estimates and projections and consequently, you should not rely on these forward-looking statements as predictions of future events. Words such as “expect”, “estimate”, “project”, “budget”, “forecast”, “anticipate”, “intend”, “plan”, “may”, “will”, “could”, “should”, “believes”, “predicts”, “potential”, “continue”, and similar expressions are intended to identify such forward-looking statements. These forward-looking statements include, without limitation, the company’s guidance for the second quarter and full year 2024 (including the company’s estimates for revenue, gross margin and non-GAAP operating expenses), the company's expectations regarding its performance during 2024, the company's strategic realignment and initiatives, the company’s expectations regarding its liquidity and capital requirements, and the company’s other expectations, hopes, beliefs, intentions or strategies for the future. These forward-looking statements involve significant risks and uncertainties that could cause the actual results to differ materially from the expected results. You should carefully consider the risks and uncertainties described in the “Risk Factors” section of the company’s Annual Report on Form 10-K for the fiscal year ended December 31, 2023 (the “FY 2023 10-K”), which was filed by the company with the SEC on April 4, 2024 and the other documents filed by the company from time to time with the SEC. These filings identify and address other important risks and uncertainties that could cause actual events and results to differ materially from those contained in the forward-looking statements. Most of these factors are outside the company’s control and are difficult to predict. Factors that may cause such differences include, but are not limited to: (1) the inability of the company to execute its business plan, which may be affected by, among other things, competition, the ability of the company to grow and manage growth profitably, maintain relationships with customers and suppliers and retain its key employees; (2) the company’s ability to continue as a going concern; (3) the company’s ability to maintain its listing on the New York Stock Exchange; (4) the company’s ability to service and comply with its indebtedness; (5) the company’s ability to raise additional capital in the future; (6) the possibility that the company may be adversely affected by other economic, business, and/or competitive factors; and (7) other risks and uncertainties indicated from time to time described in the FY 2023 10-K, including those under “Risk Factors” therein, and in the company’s other filings with the SEC. The company cautions that the foregoing list of factors is not exclusive and not to place undue reliance upon any forward-looking statements, including projections, which speak only as of the date made. The company does not undertake or accept any obligation to release publicly any updates or revisions to any forward-looking statements to reflect any change in its expectations or any change in events, conditions or circumstances on which any such statement is based.


• • • • • • • • • • • •

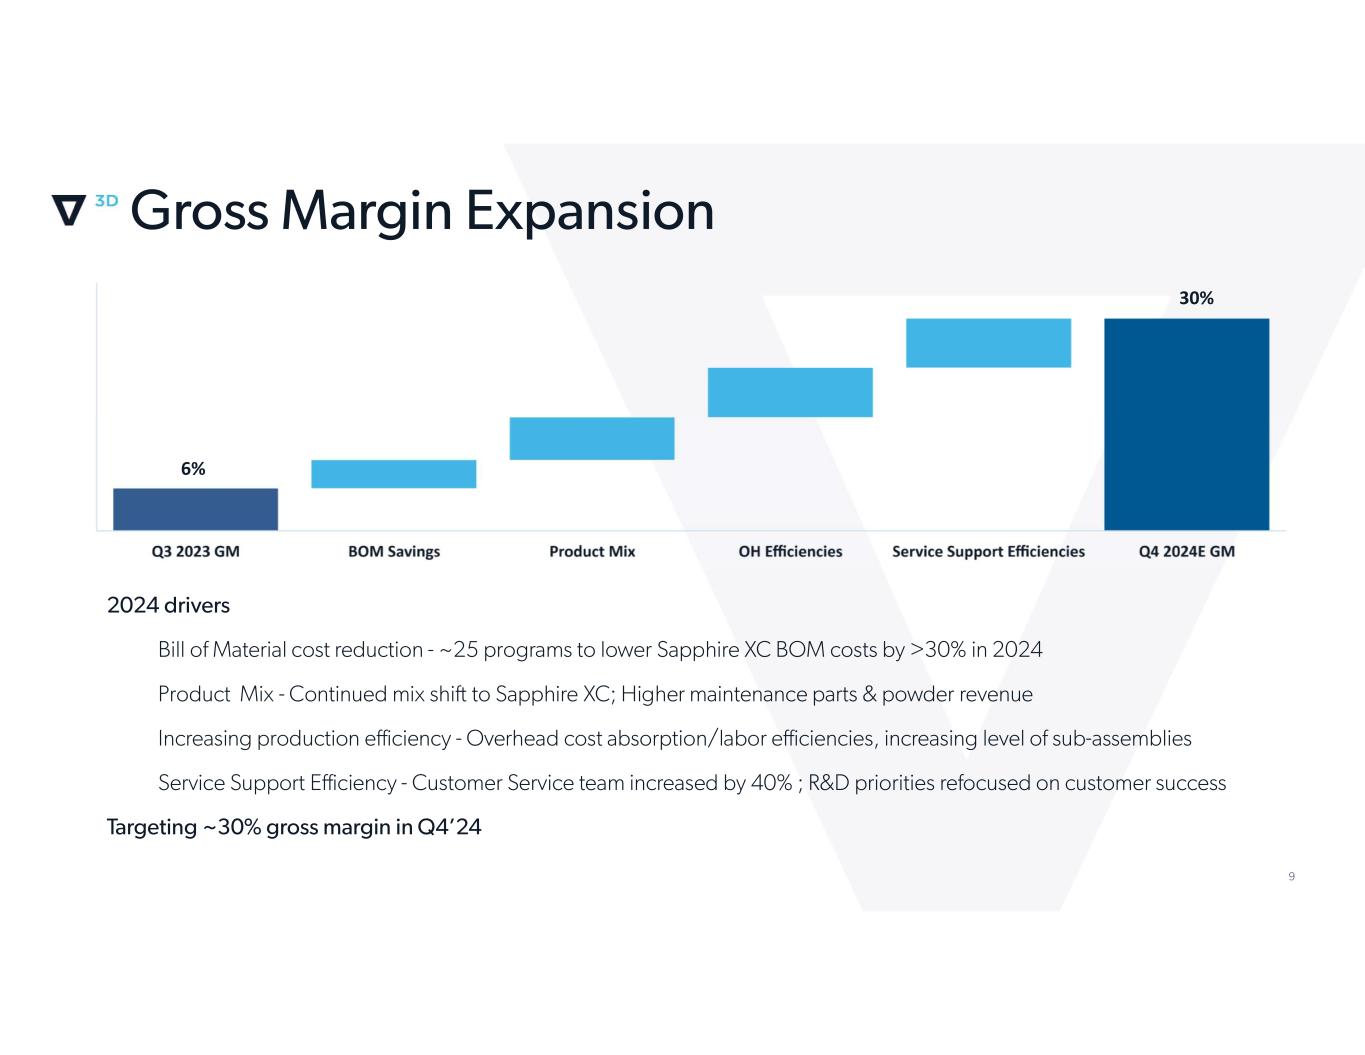
6% 30%
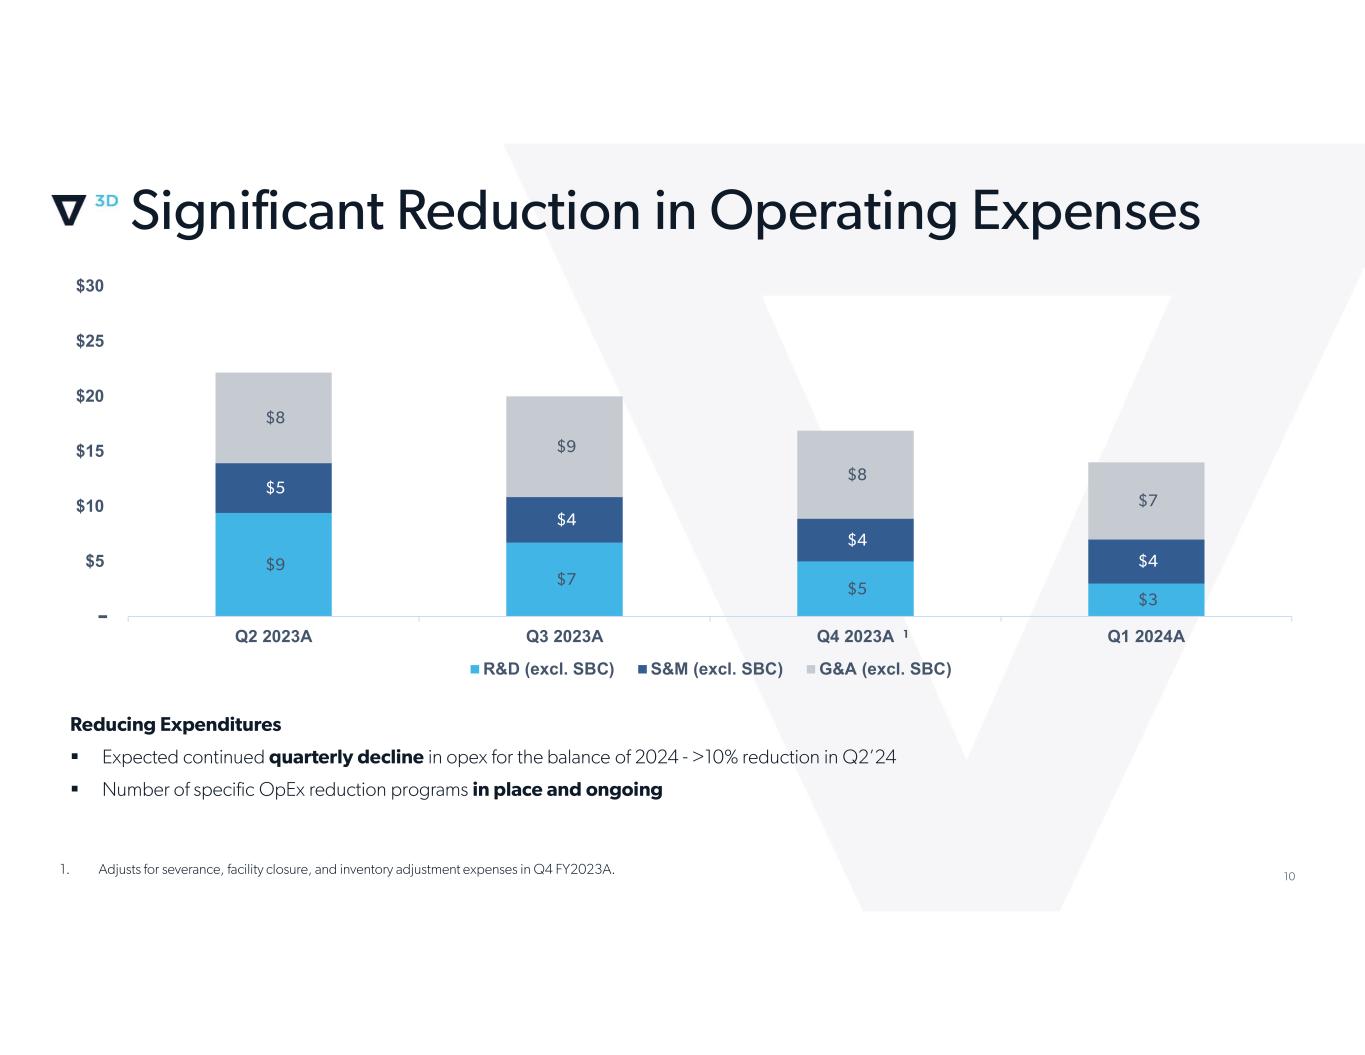
$5 $10 $15 $20 $25 $30 Q2 2023A Q3 2023A Q4 2023A Q1 2024A R&D (excl. SBC) S&M (excl. SBC) G&A (excl. SBC)


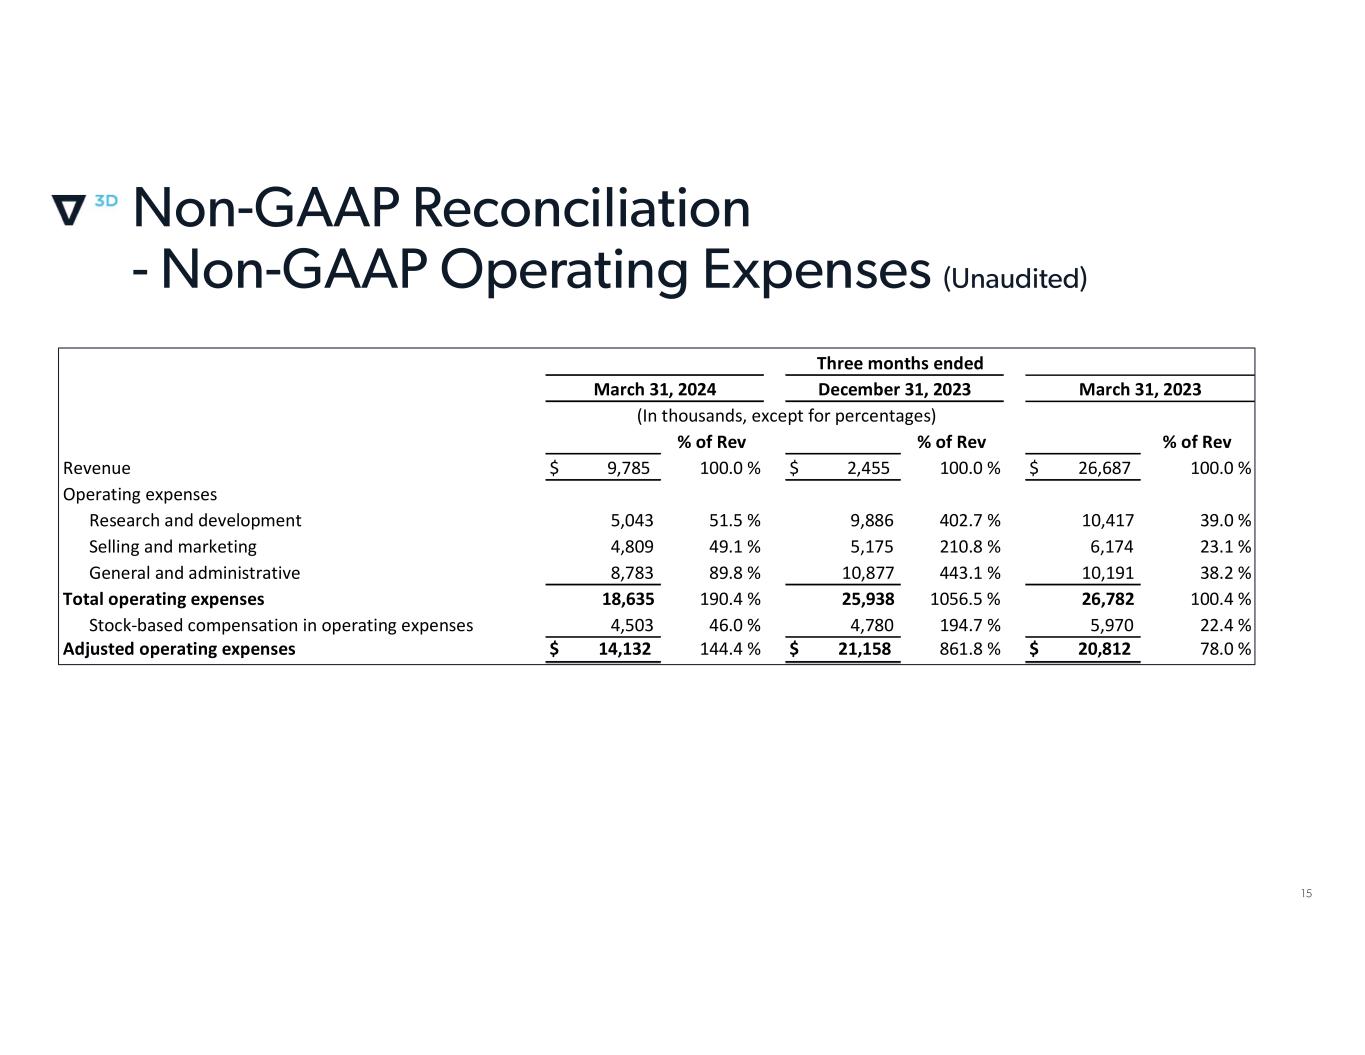
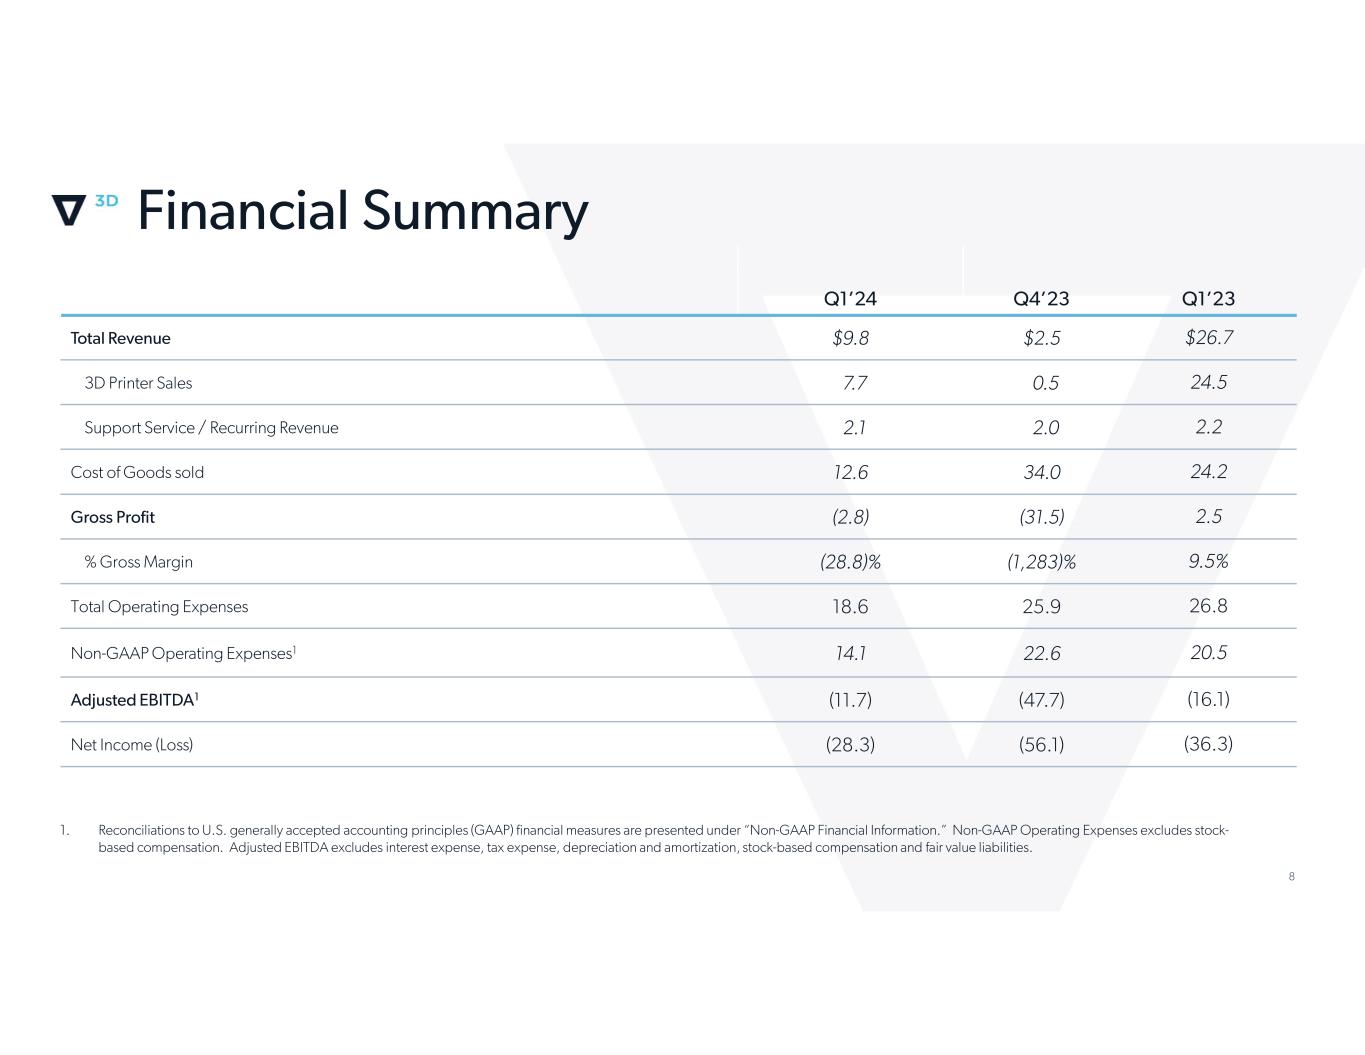
% of Rev % of Rev % of Rev Revenue $ 9,785 100.0 % $ 2,455 100.0 % $ 26,687 100.0 % Operating expenses Research and development 5,043 51.5 % 9,886 402.7 % 10,417 39.0 % Selling and marketing 4,809 49.1 % 5,175 210.8 % 6,174 23.1 % General and administrative 8,783 89.8 % 10,877 443.1 % 10,191 38.2 % Total operating expenses 18,635 190.4 % 25,938 1056.5 % 26,782 100.4 % Stock-based compensation in operating expenses 4,503 46.0 % 4,780 194.7 % 5,970 22.4 % Adjusted operating expenses $ 14,132 144.4 % $ 21,158 861.8 % $ 20,812 78.0 % (In thousands, except for percentages) Three months ended March 31, 2024 December 31, 2023 March 31, 2023
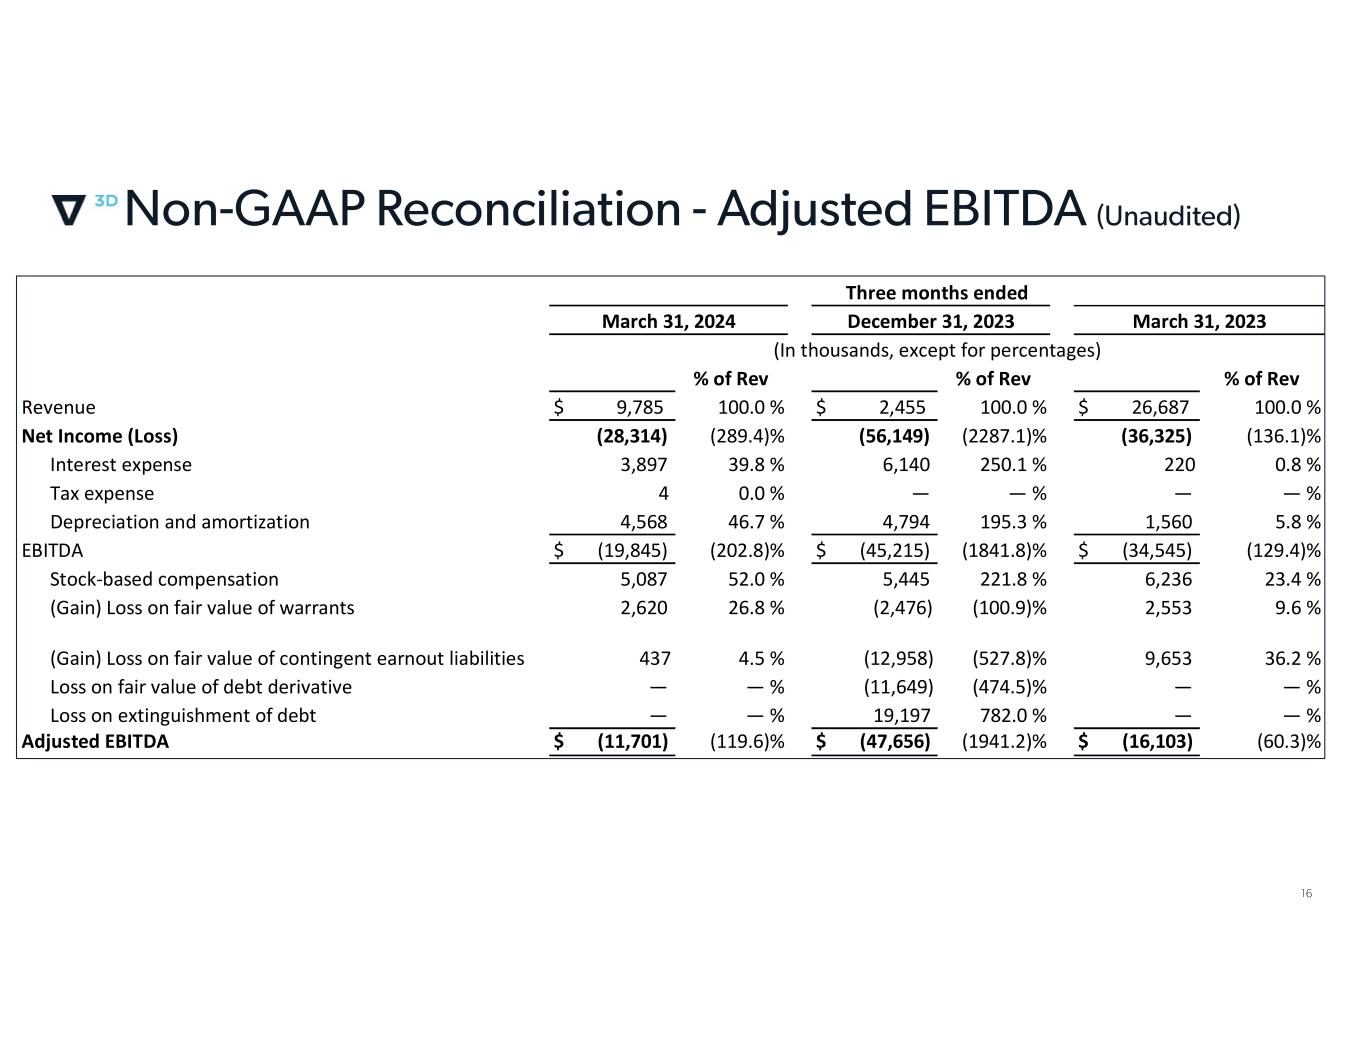
% of Rev % of Rev % of Rev Revenue $ 9,785 100.0 % $ 2,455 100.0 % $ 26,687 100.0 % Net Income (Loss) (28,314) (289.4)% (56,149) (2287.1)% (36,325) (136.1)% Interest expense 3,897 39.8 % 6,140 250.1 % 220 0.8 % Tax expense 4 0.0 % — — % — — % Depreciation and amortization 4,568 46.7 % 4,794 195.3 % 1,560 5.8 % EBITDA $ (19,845) (202.8)% $ (45,215) (1841.8)% $ (34,545) (129.4)% Stock-based compensation 5,087 52.0 % 5,445 221.8 % 6,236 23.4 % (Gain) Loss on fair value of warrants 2,620 26.8 % (2,476) (100.9)% 2,553 9.6 % (Gain) Loss on fair value of contingent earnout liabilities 437 4.5 % (12,958) (527.8)% 9,653 36.2 % Loss on fair value of debt derivative — — % (11,649) (474.5)% — — % Loss on extinguishment of debt — — % 19,197 782.0 % — — % Adjusted EBITDA $ (11,701) (119.6)% $ (47,656) (1941.2)% $ (16,103) (60.3)% (In thousands, except for percentages) Three months ended March 31, 2024 December 31, 2023 March 31, 2023
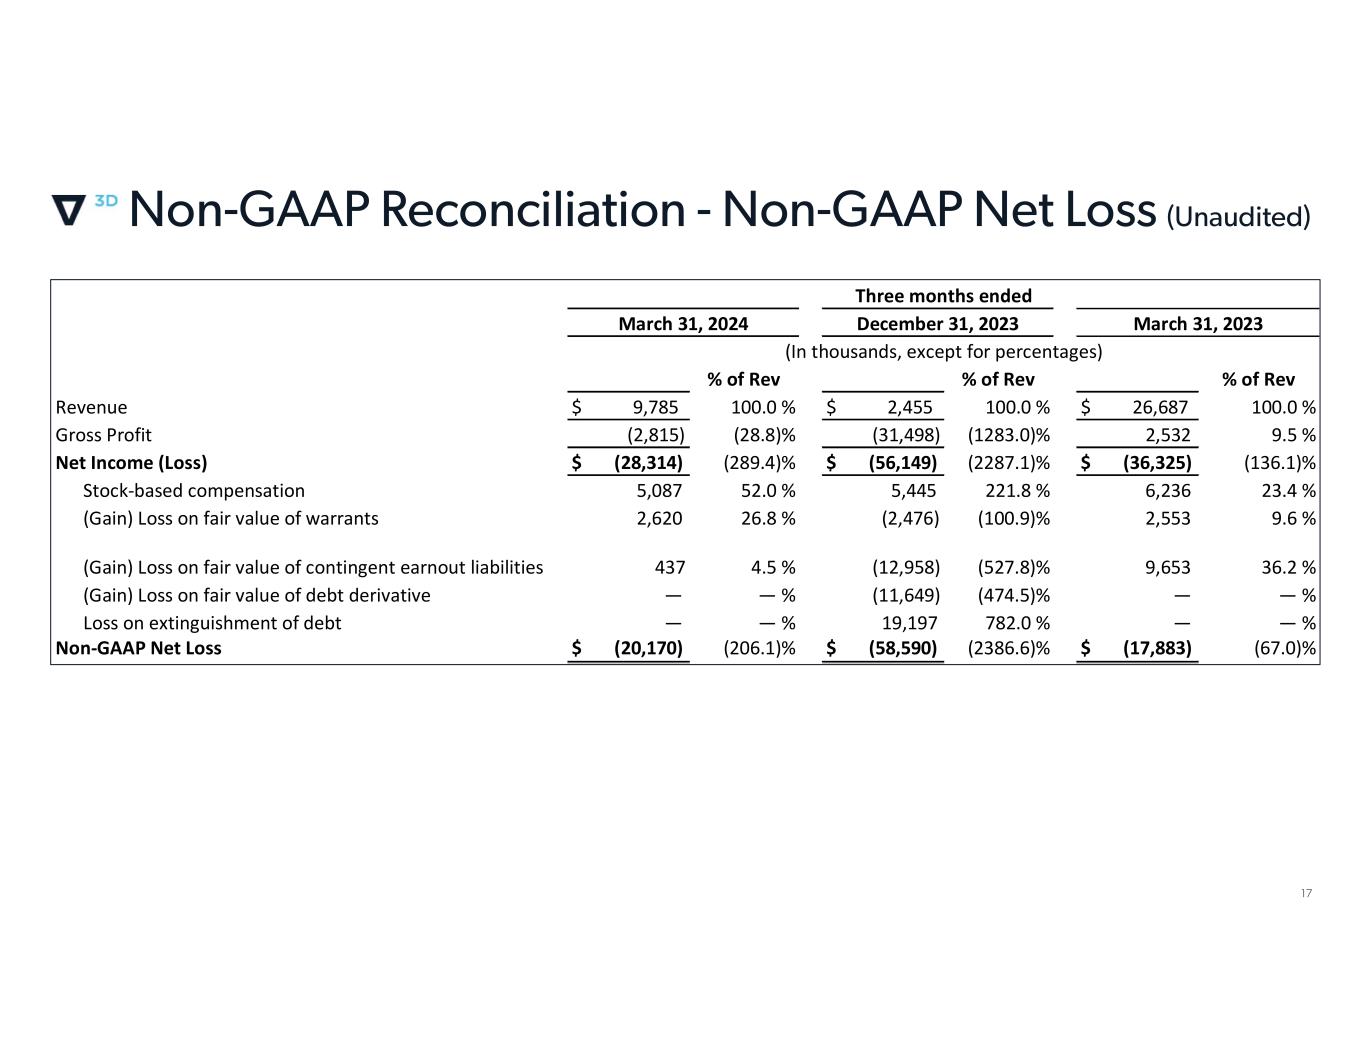
% of Rev % of Rev % of Rev Revenue $ 9,785 100.0 % $ 2,455 100.0 % $ 26,687 100.0 % Gross Profit (2,815) (28.8)% (31,498) (1283.0)% 2,532 9.5 % Net Income (Loss) $ (28,314) (289.4)% $ (56,149) (2287.1)% $ (36,325) (136.1)% Stock-based compensation 5,087 52.0 % 5,445 221.8 % 6,236 23.4 % (Gain) Loss on fair value of warrants 2,620 26.8 % (2,476) (100.9)% 2,553 9.6 % (Gain) Loss on fair value of contingent earnout liabilities 437 4.5 % (12,958) (527.8)% 9,653 36.2 % (Gain) Loss on fair value of debt derivative — — % (11,649) (474.5)% — — % Loss on extinguishment of debt — — % 19,197 782.0 % — — % Non-GAAP Net Loss $ (20,170) (206.1)% $ (58,590) (2386.6)% $ (17,883) (67.0)% (In thousands, except for percentages) Three months ended March 31, 2024 December 31, 2023 March 31, 2023
