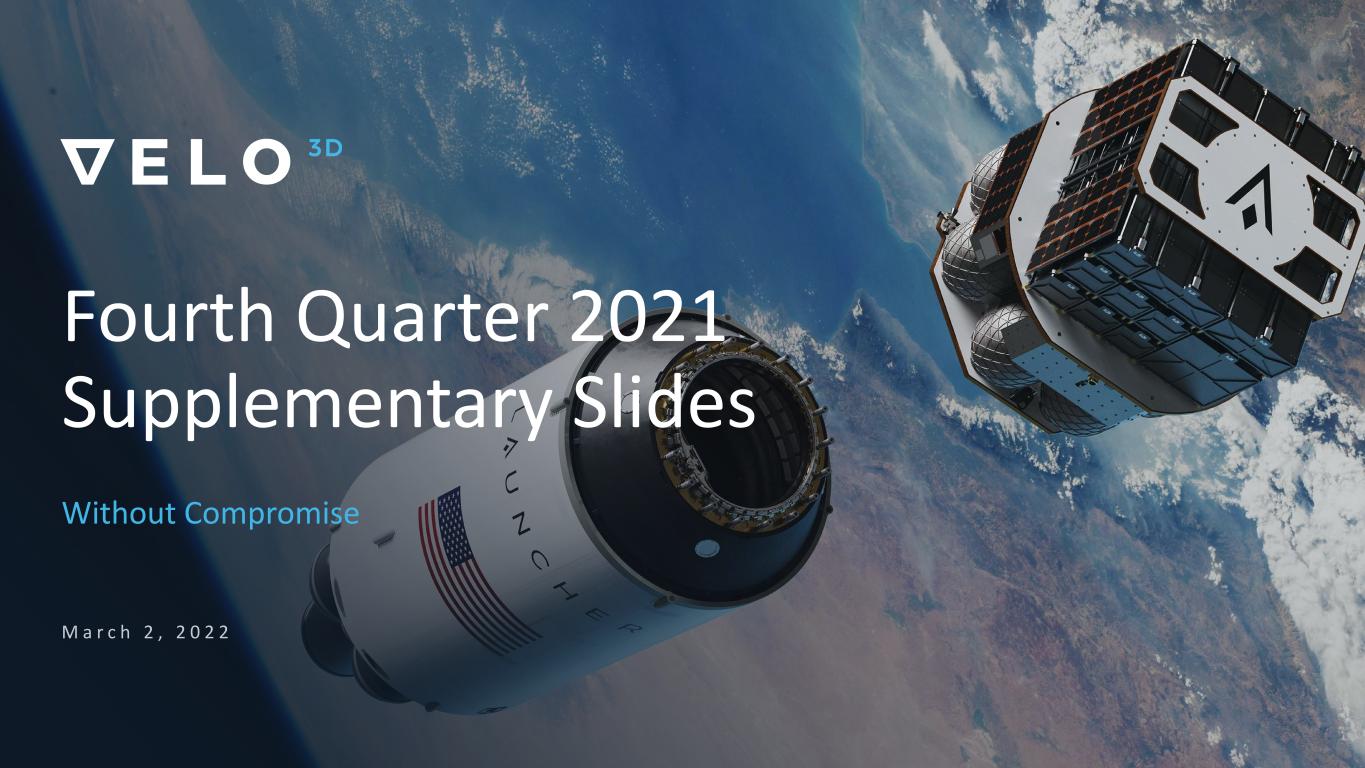
Fourth Quarter 2021 Supplementary Slides Without Compromise M a r c h 2 , 2 0 2 2
2 Disclaimer * Additional information on the use of Non-GAAP financial information, industry and market data and trademarks is included in the appendix of this presentation This presentation includes “forward-looking statements” within the meaning of the “safe harbor” provisions of the Private Securities Litigation Reform Act of 1996. The Company’s actual results may differ from its expectations, estimates and projections and consequently, you should not rely on these forward-looking statements as predictions of future events. Words such as “expect”, “estimate”, “project”, “budget”, “forecast”, “anticipate”, “intend”, “plan”, “may”, “will”, “could”, “should”, “believes”, “predicts”, “potential”, “continue”, and similar expressions are intended to identify such forward-looking statements. These forward-looking statements include, without limitation, the Company’s guidance for full year 2022 (including the Company’s estimates for new and total customers, bookings, Sapphire, Sapphire XC and total shipments, units operating, average existing customers’ purchases, revenue at year of sale, recurring revenue and total revenue, year of sale ASP and average ARR), the Company’s revenue forecast for 2022 and its ability to achieve such forecast, the Company’s expectations regarding its pricing, expenses and gross margin during 2022, the Company’s strategic priorities for 2022 (including the Company’s customer expansion plans), the timing and benefits of the Company’s manufacturing facility expansion, the expected benefits of the Company’s investments, the Company’s expectations regarding its capital requirements, and the Company’s other expectations, hopes, beliefs, intentions or strategies for the future. These forward-looking statements involve significant risks and uncertainties that could cause the actual results to differ materially from the expected results. You should carefully consider the risks and uncertainties described in the “Risk Factors” section of the Company’s Quarterly Report on Form 10- Q for the fiscal quarter ended September 30, 2021 (the “Q3 2021 10-Q”), which was filed by the Company with the SEC on November 16, 2021 and the other documents filed by the Company from time to time with the SEC. These filings identify and address other important risks and uncertainties that could cause actual events and results to differ materially from those contained in the forward-looking statements. Most of these factors are outside the Company’s control and are difficult to predict. Factors that may cause such differences include, but are not limited to: (1) the inability to recognize the anticipated benefits of the merger transaction, which may be affected by, among other things, competition, the ability of the Company to grow and manage growth profitably, maintain relationships with customers and suppliers and retain its key employees; (2) costs related to the merger transaction; (3) changes in the applicable laws or regulations; (4) the possibility that the Company may be adversely affected by other economic, business, and/or competitive factors; (5) the impact of the global COVID-19 pandemic; and (6) other risks and uncertainties indicated from time to time described in the Q3 2021 10-Q, including those under “Risk Factors” therein, and in the Company’s other filings with the SEC. The Company cautions that the foregoing list of factors is not exclusive and not to place undue reliance upon any forward-looking statements, including projections, which speak only as of the date made. The Company does not undertake or accept any obligation to release publicly any updates or revisions to any forward-looking statements to reflect any change in its expectations or any change in events, conditions or circumstances on which any such statement is based.

Confidential & Proprietary | 3 Benny Buller CEO M a r c h 2 , 2 0 2 2
4 Q4 / 2021 Highlights • Exceeded Q421 revenue guidance – up 20% sequentially, 54% YoY • 2021 revenue ahead of plan – 45% YoY growth to $27m • Shipped first Sapphire XC system – Q421 • Shipped 23 systems in 2021, up 77% YoY – record 8 shipments in Q421 • Surpassed Q4 / 2021 bookings target – 34 systems vs 24 goal for 2021 • Significant backlog – 23 firm orders vs plan of 20 • Maintained strong balance sheet – exited year with $223m in cash • Increasing confidence / visibility in achieving 2022 revenue forecast of $89m
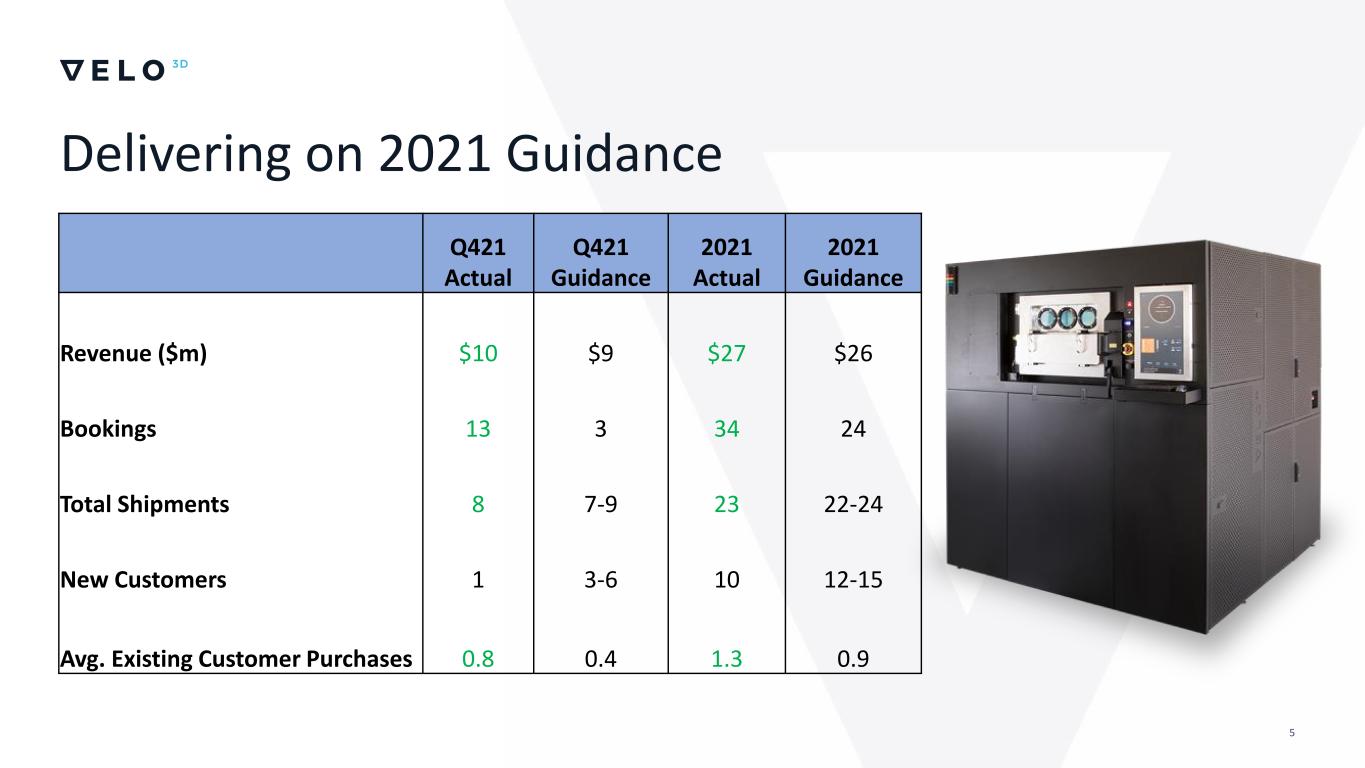
5 Delivering on 2021 Guidance Q421 Actual Q421 Guidance 2021 Actual 2021 Guidance Revenue ($m) $10 $9 $27 $26 Bookings 13 3 34 24 Total Shipments 8 7-9 23 22-24 New Customers 1 3-6 10 12-15 Avg. Existing Customer Purchases 0.8 0.4 1.3 0.9
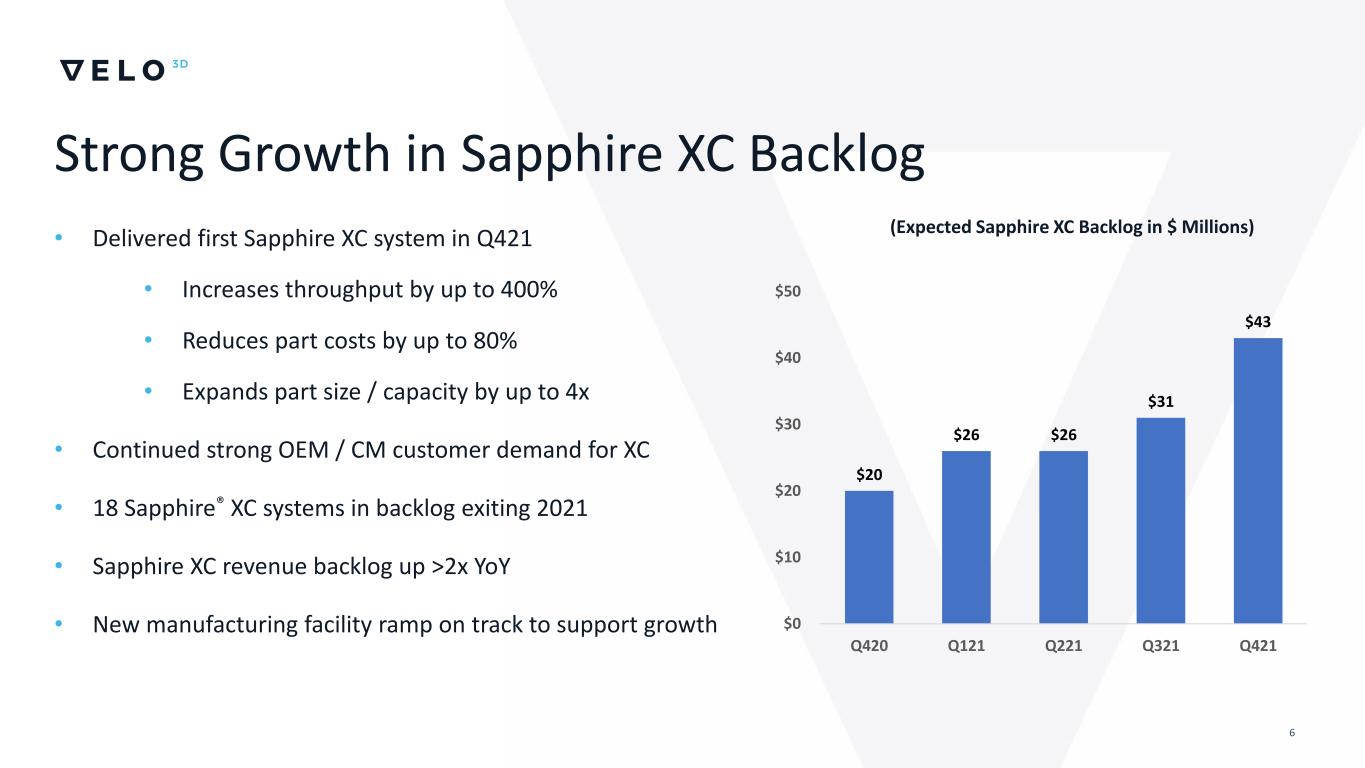
6 • Delivered first Sapphire XC system in Q421 • Increases throughput by up to 400% • Reduces part costs by up to 80% • Expands part size / capacity by up to 4x • Continued strong OEM / CM customer demand for XC • 18 Sapphire® XC systems in backlog exiting 2021 • Sapphire XC revenue backlog up >2x YoY • New manufacturing facility ramp on track to support growth Strong Growth in Sapphire XC Backlog (Expected Sapphire XC Backlog in $ Millions) $20 $26 $26 $31 $43 $0 $10 $20 $30 $40 $50 Q420 Q121 Q221 Q321 Q421
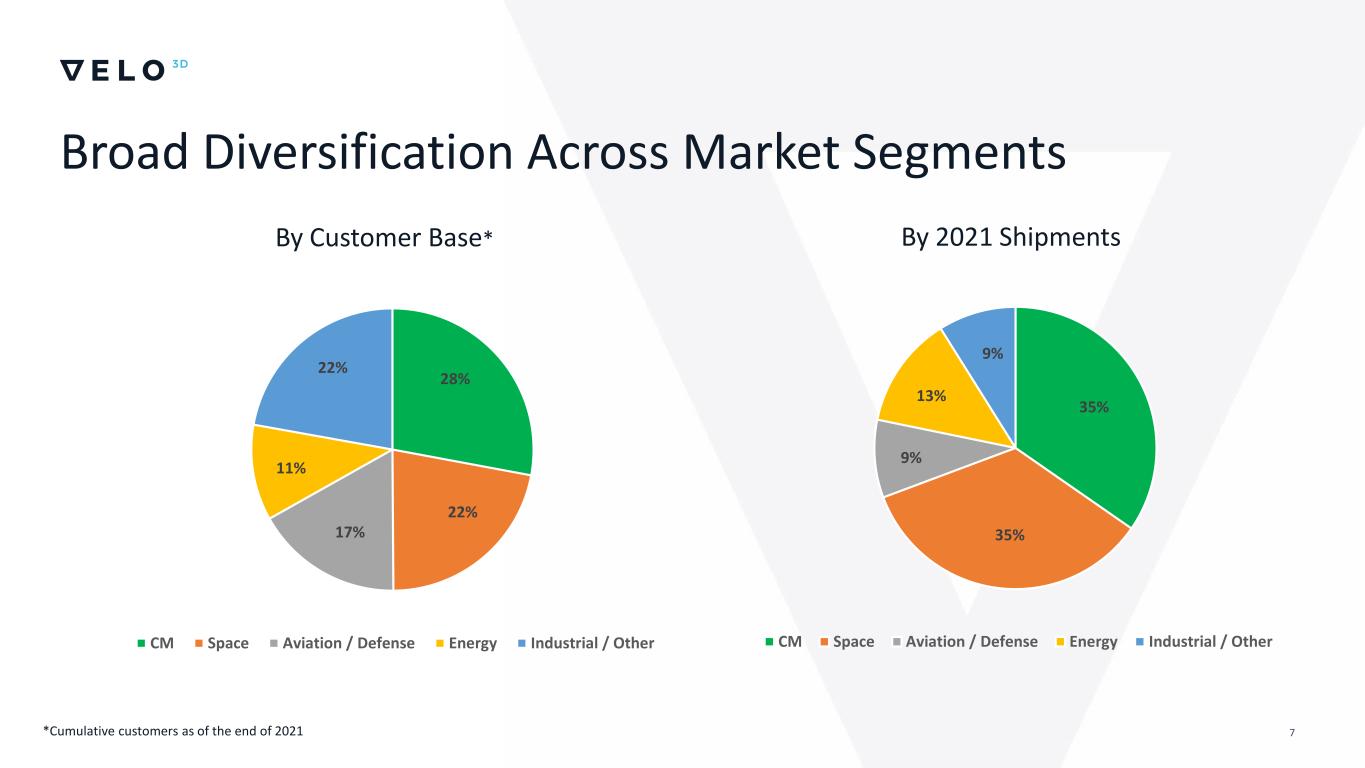
7 By Customer Base* By 2021 Shipments Broad Diversification Across Market Segments 28% 22% 17% 11% 22% CM Space Aviation / Defense Energy Industrial / Other 35% 35% 9% 13% 9% CM Space Aviation / Defense Energy Industrial / Other *Cumulative customers as of the end of 2021
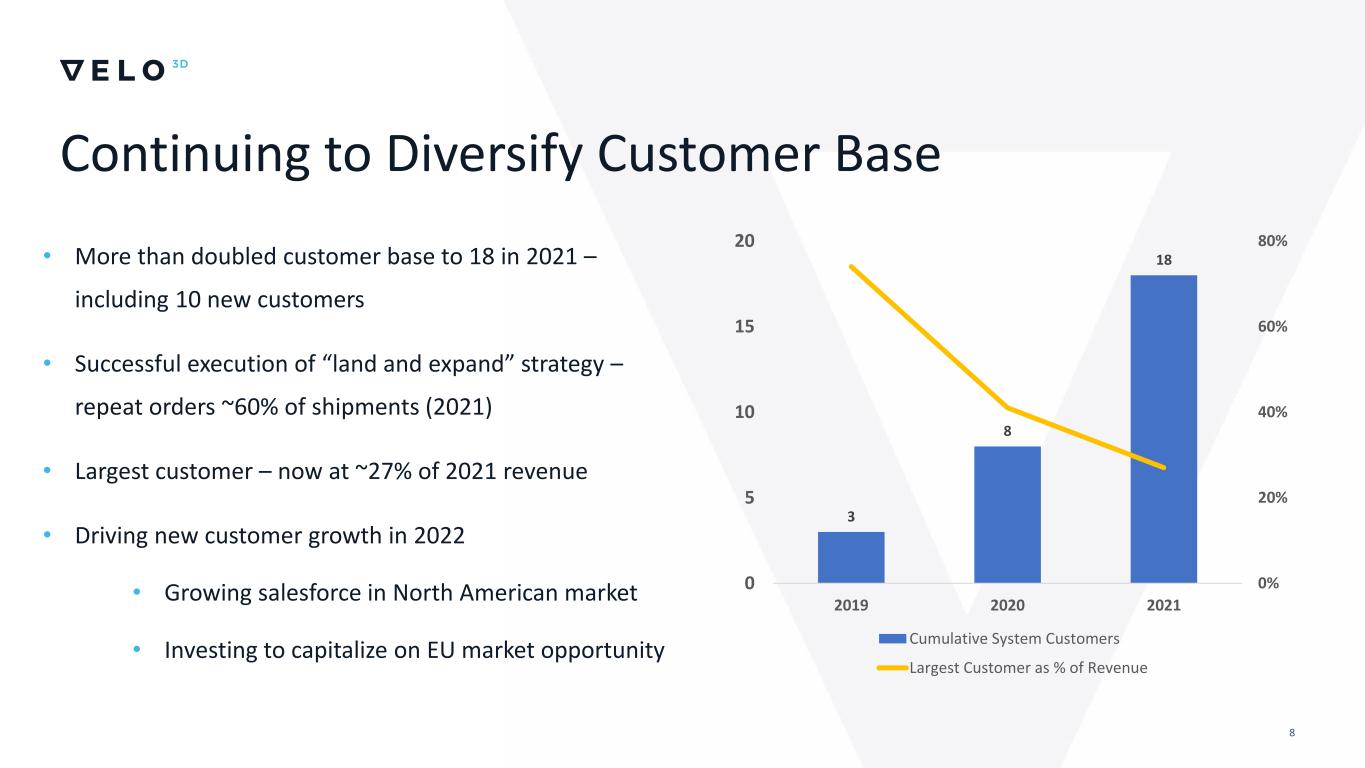
8 Continuing to Diversify Customer Base • More than doubled customer base to 18 in 2021 – including 10 new customers • Successful execution of “land and expand” strategy – repeat orders ~60% of shipments (2021) • Largest customer – now at ~27% of 2021 revenue • Driving new customer growth in 2022 • Growing salesforce in North American market • Investing to capitalize on EU market opportunity 3 8 18 0% 20% 40% 60% 80% 0 5 10 15 20 2019 2020 2021 Cumulative System Customers Largest Customer as % of Revenue
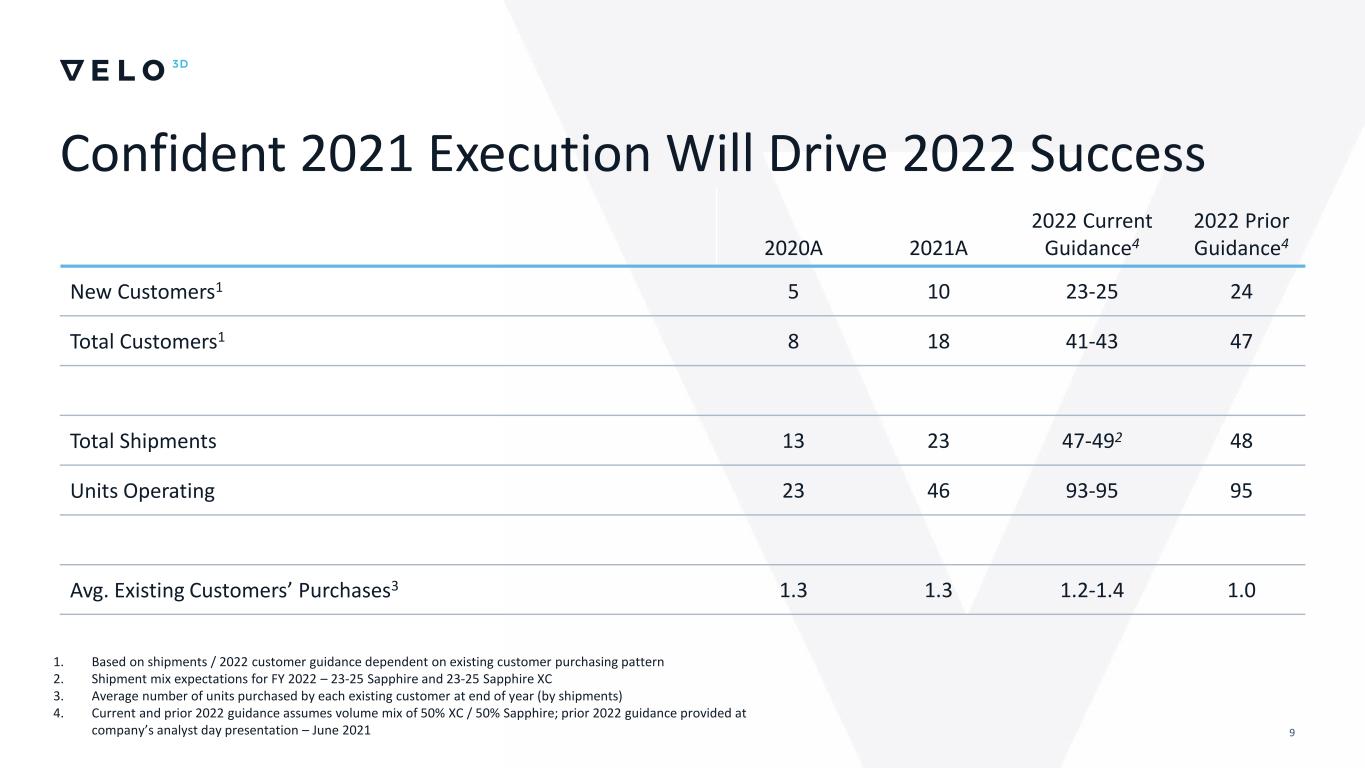
9 2020A 2021A 2022 Current Guidance4 2022 Prior Guidance4 New Customers1 5 10 23-25 24 Total Customers1 8 18 41-43 47 Total Shipments 13 23 47-492 48 Units Operating 23 46 93-95 95 Avg. Existing Customers’ Purchases3 1.3 1.3 1.2-1.4 1.0 1. Based on shipments / 2022 customer guidance dependent on existing customer purchasing pattern 2. Shipment mix expectations for FY 2022 – 23-25 Sapphire and 23-25 Sapphire XC 3. Average number of units purchased by each existing customer at end of year (by shipments) 4. Current and prior 2022 guidance assumes volume mix of 50% XC / 50% Sapphire; prior 2022 guidance provided at company’s analyst day presentation – June 2021 Confident 2021 Execution Will Drive 2022 Success
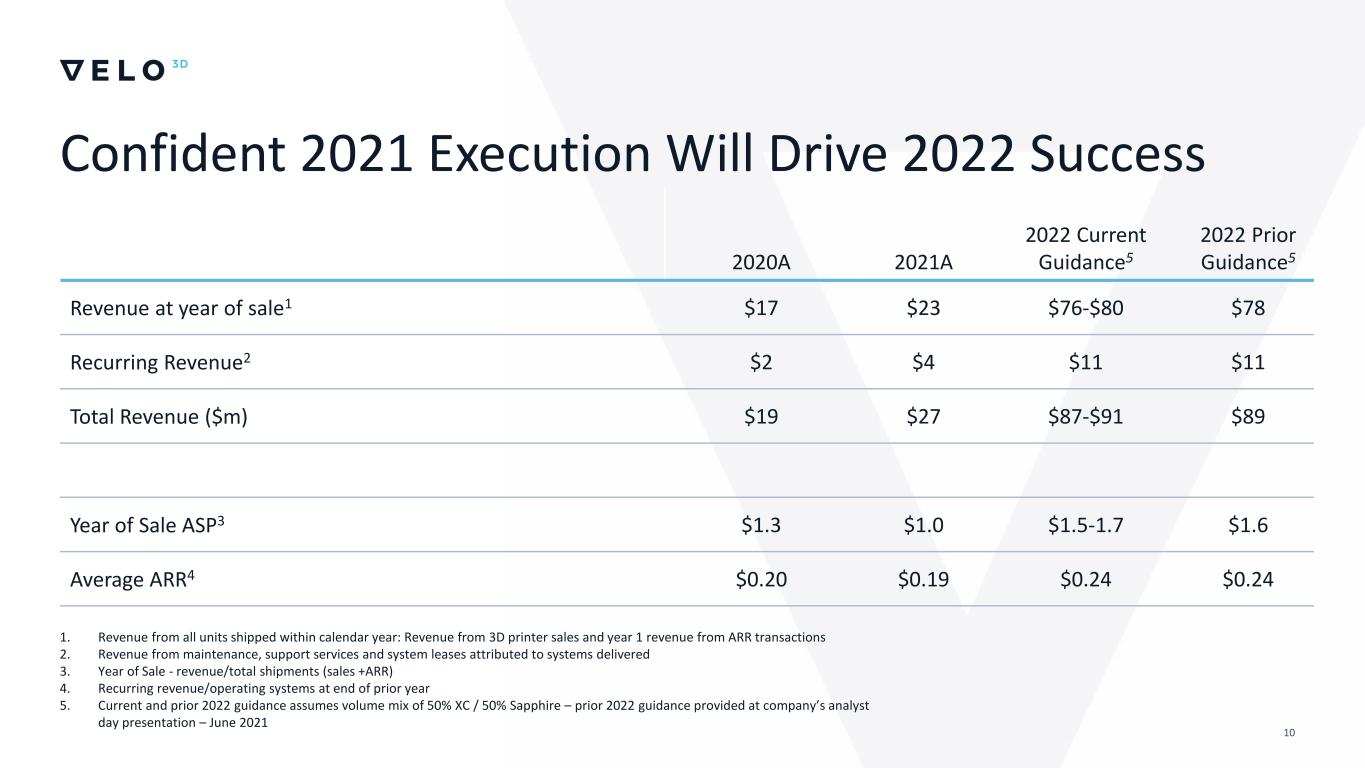
10 Confident 2021 Execution Will Drive 2022 Success 1. Revenue from all units shipped within calendar year: Revenue from 3D printer sales and year 1 revenue from ARR transactions 2. Revenue from maintenance, support services and system leases attributed to systems delivered 3. Year of Sale - revenue/total shipments (sales +ARR) 4. Recurring revenue/operating systems at end of prior year 5. Current and prior 2022 guidance assumes volume mix of 50% XC / 50% Sapphire – prior 2022 guidance provided at company’s analyst day presentation – June 2021 2020A 2021A 2022 Current Guidance5 2022 Prior Guidance5 Revenue at year of sale1 $17 $23 $76-$80 $78 Recurring Revenue2 $2 $4 $11 $11 Total Revenue ($m) $19 $27 $87-$91 $89 Year of Sale ASP3 $1.3 $1.0 $1.5-1.7 $1.6 Average ARR4 $0.20 $0.19 $0.24 $0.24
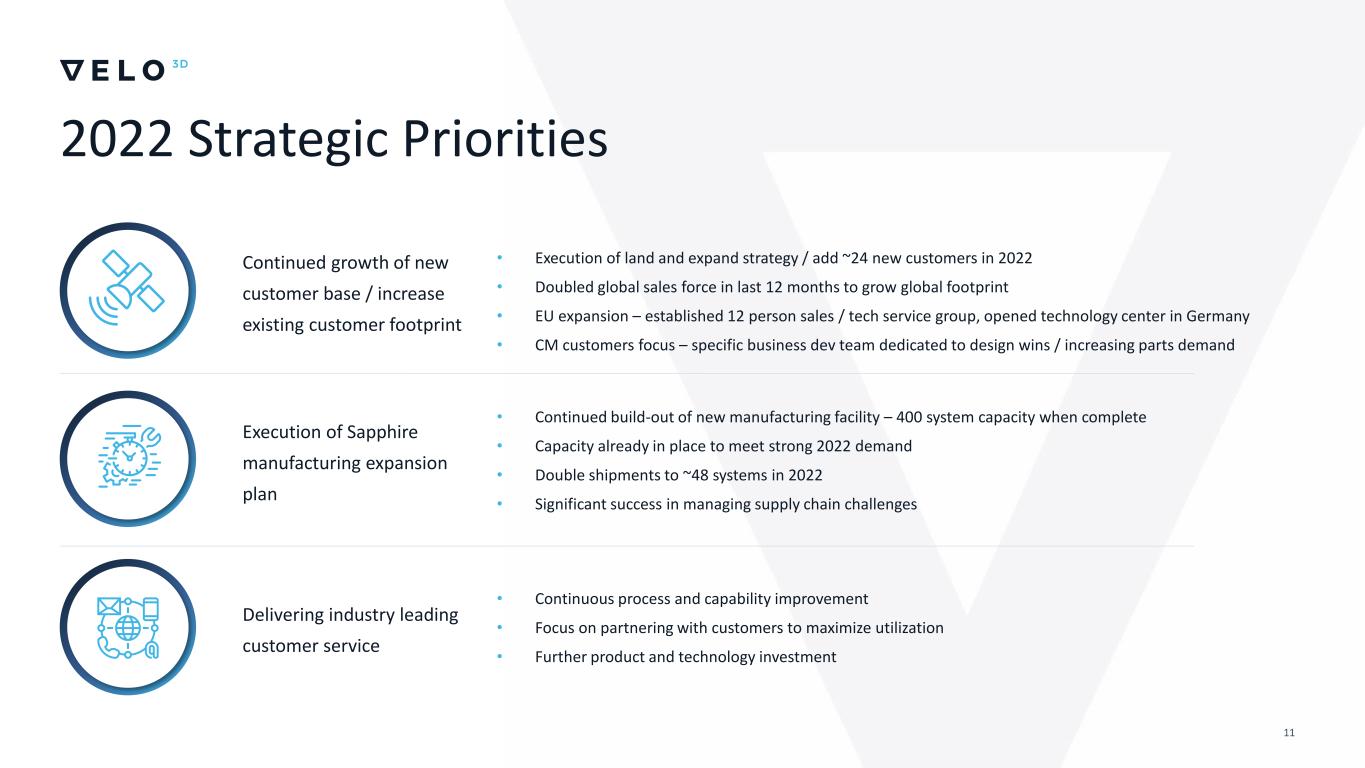
11 2022 Strategic Priorities • Execution of land and expand strategy / add ~24 new customers in 2022 • Doubled global sales force in last 12 months to grow global footprint • EU expansion – established 12 person sales / tech service group, opened technology center in Germany • CM customers focus – specific business dev team dedicated to design wins / increasing parts demand Continued growth of new customer base / increase existing customer footprint • Continued build-out of new manufacturing facility – 400 system capacity when complete • Capacity already in place to meet strong 2022 demand • Double shipments to ~48 systems in 2022 • Significant success in managing supply chain challenges Execution of Sapphire manufacturing expansion plan • Continuous process and capability improvement • Focus on partnering with customers to maximize utilization • Further product and technology investment Delivering industry leading customer service

Confidential & Proprietary | 12 Bill McCombe CFO M a r c h 2 , 2 0 2 2
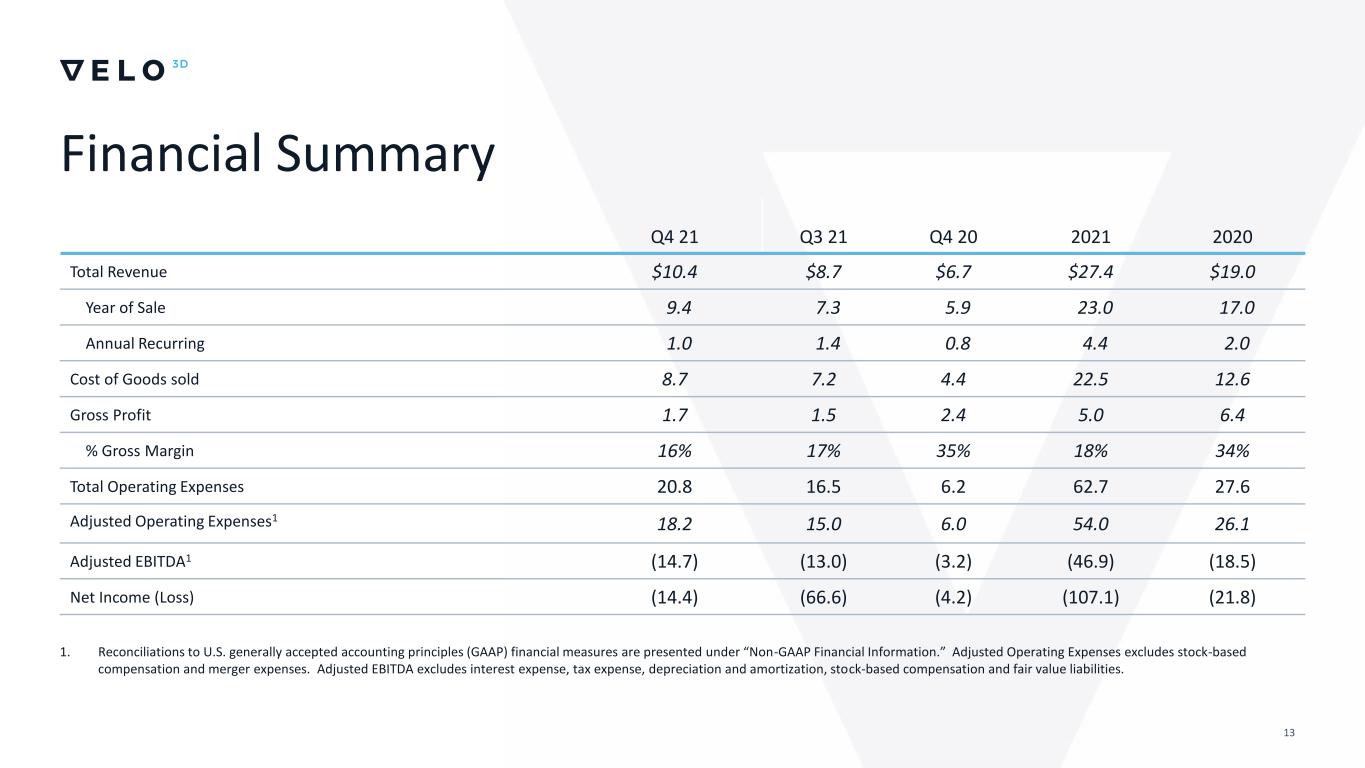
13 Financial Summary 1. Reconciliations to U.S. generally accepted accounting principles (GAAP) financial measures are presented under “Non-GAAP Financial Information.” Adjusted Operating Expenses excludes stock-based compensation and merger expenses. Adjusted EBITDA excludes interest expense, tax expense, depreciation and amortization, stock-based compensation and fair value liabilities. Q4 21 Q3 21 Q4 20 2021 2020 Total Revenue $10.4 $8.7 $6.7 $27.4 $19.0 Year of Sale 9.4 7.3 5.9 23.0 17.0 Annual Recurring 1.0 1.4 0.8 4.4 2.0 Cost of Goods sold 8.7 7.2 4.4 22.5 12.6 Gross Profit 1.7 1.5 2.4 5.0 6.4 % Gross Margin 16% 17% 35% 18% 34% Total Operating Expenses 20.8 16.5 6.2 62.7 27.6 Adjusted Operating Expenses1 18.2 15.0 6.0 54.0 26.1 Adjusted EBITDA1 (14.7) (13.0) (3.2) (46.9) (18.5) Net Income (Loss) (14.4) (66.6) (4.2) (107.1) (21.8)
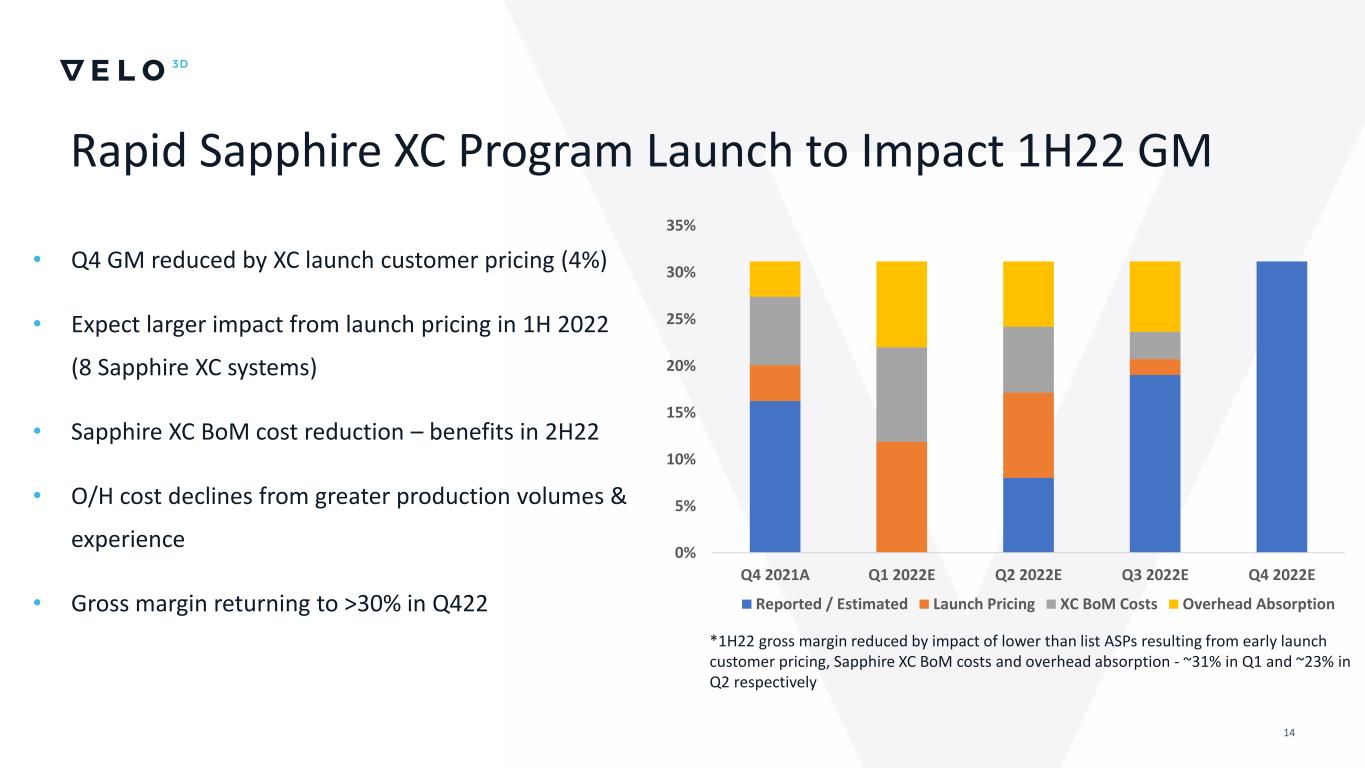
14 • Q4 GM reduced by XC launch customer pricing (4%) • Expect larger impact from launch pricing in 1H 2022 (8 Sapphire XC systems) • Sapphire XC BoM cost reduction – benefits in 2H22 • O/H cost declines from greater production volumes & experience • Gross margin returning to >30% in Q422 *1H22 gross margin reduced by impact of lower than list ASPs resulting from early launch customer pricing, Sapphire XC BoM costs and overhead absorption - ~31% in Q1 and ~23% in Q2 respectively Rapid Sapphire XC Program Launch to Impact 1H22 GM 0% 5% 10% 15% 20% 25% 30% 35% Q4 2021A Q1 2022E Q2 2022E Q3 2022E Q4 2022E Reported / Estimated Launch Pricing XC BoM Costs Overhead Absorption
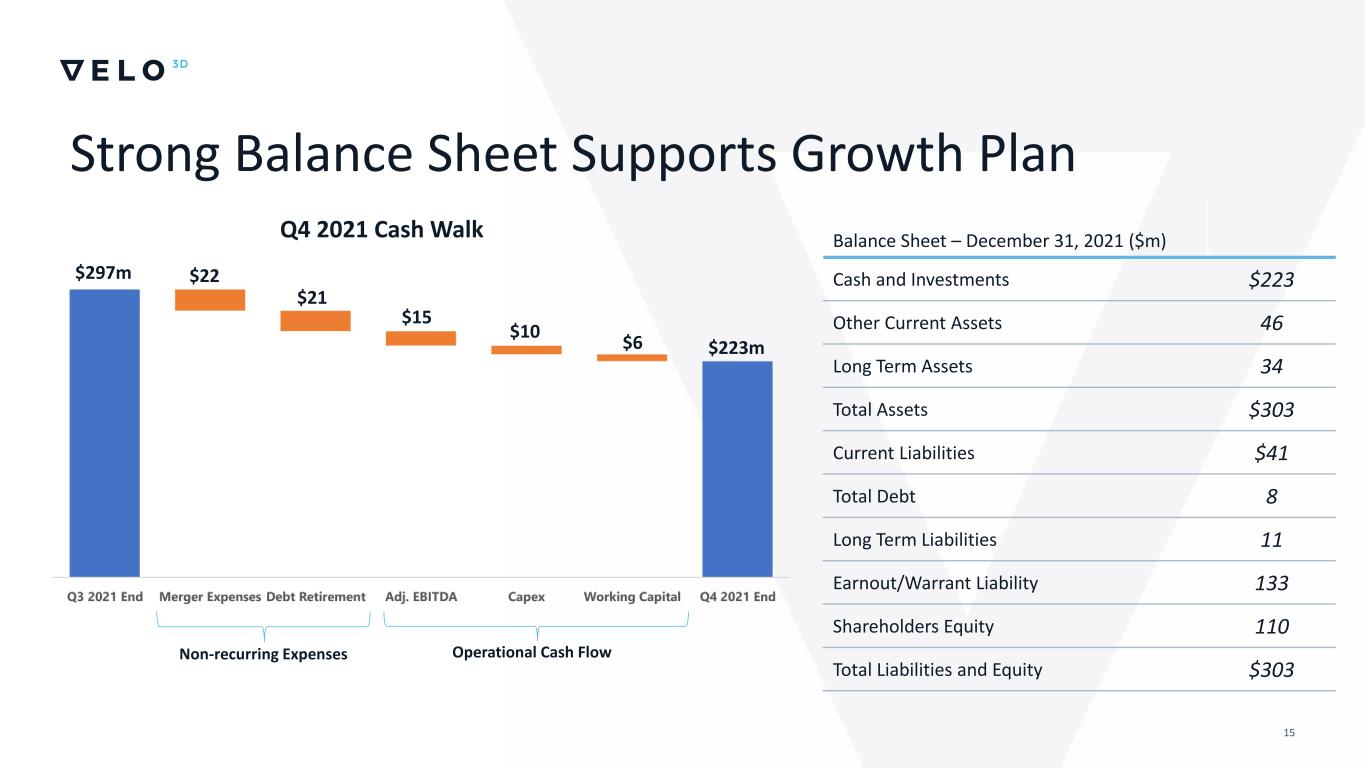
15 Strong Balance Sheet Supports Growth Plan Q4 2021 Cash Walk $297m $22 $21 $223m $10 $6 Non-recurring Expenses Balance Sheet – December 31, 2021 ($m) Cash and Investments $223 Other Current Assets 46 Long Term Assets 34 Total Assets $303 Current Liabilities $41 Total Debt 8 Long Term Liabilities 11 Earnout/Warrant Liability 133 Shareholders Equity 110 Total Liabilities and Equity $303 Operational Cash Flow $15
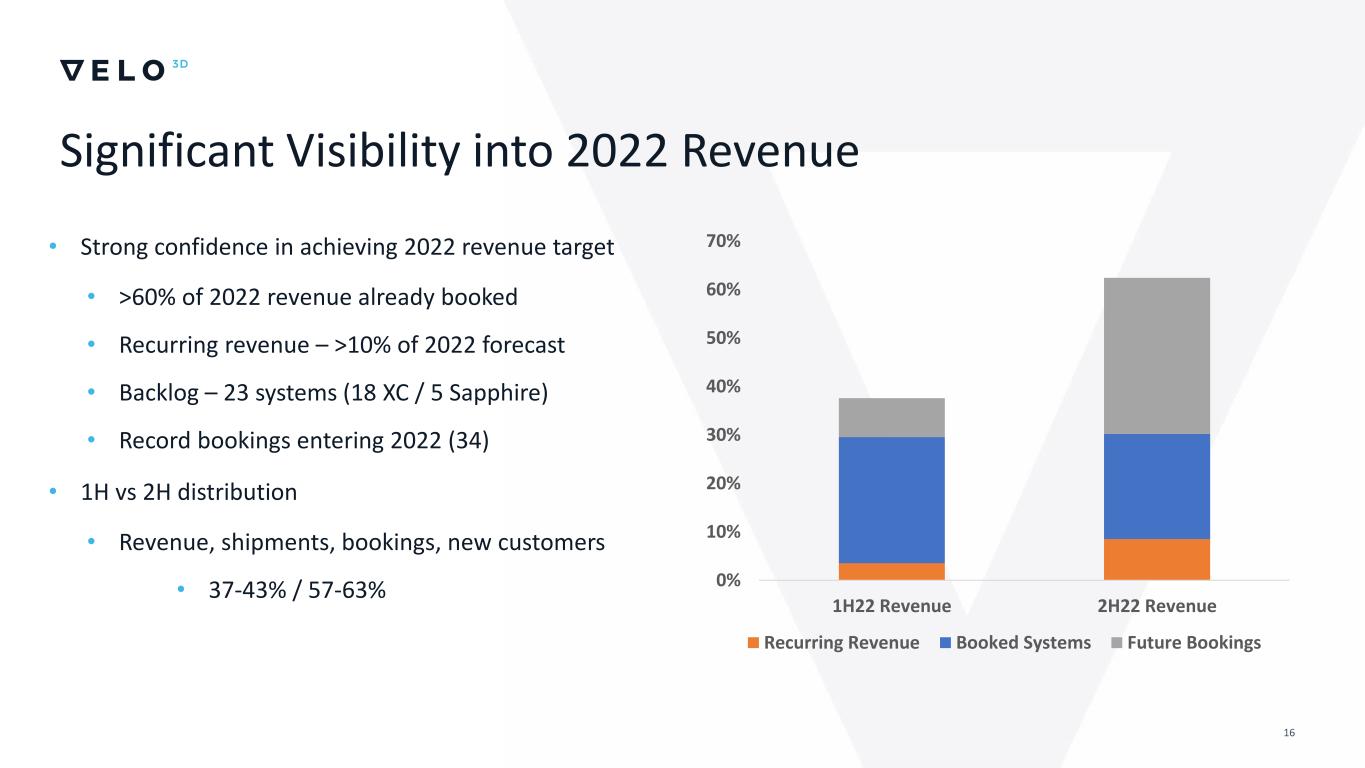
16 Significant Visibility into 2022 Revenue • Strong confidence in achieving 2022 revenue target • >60% of 2022 revenue already booked • Recurring revenue – >10% of 2022 forecast • Backlog – 23 systems (18 XC / 5 Sapphire) • Record bookings entering 2022 (34) • 1H vs 2H distribution • Revenue, shipments, bookings, new customers • 37-43% / 57-63% 0% 10% 20% 30% 40% 50% 60% 70% 1H22 Revenue 2H22 Revenue Recurring Revenue Booked Systems Future Bookings
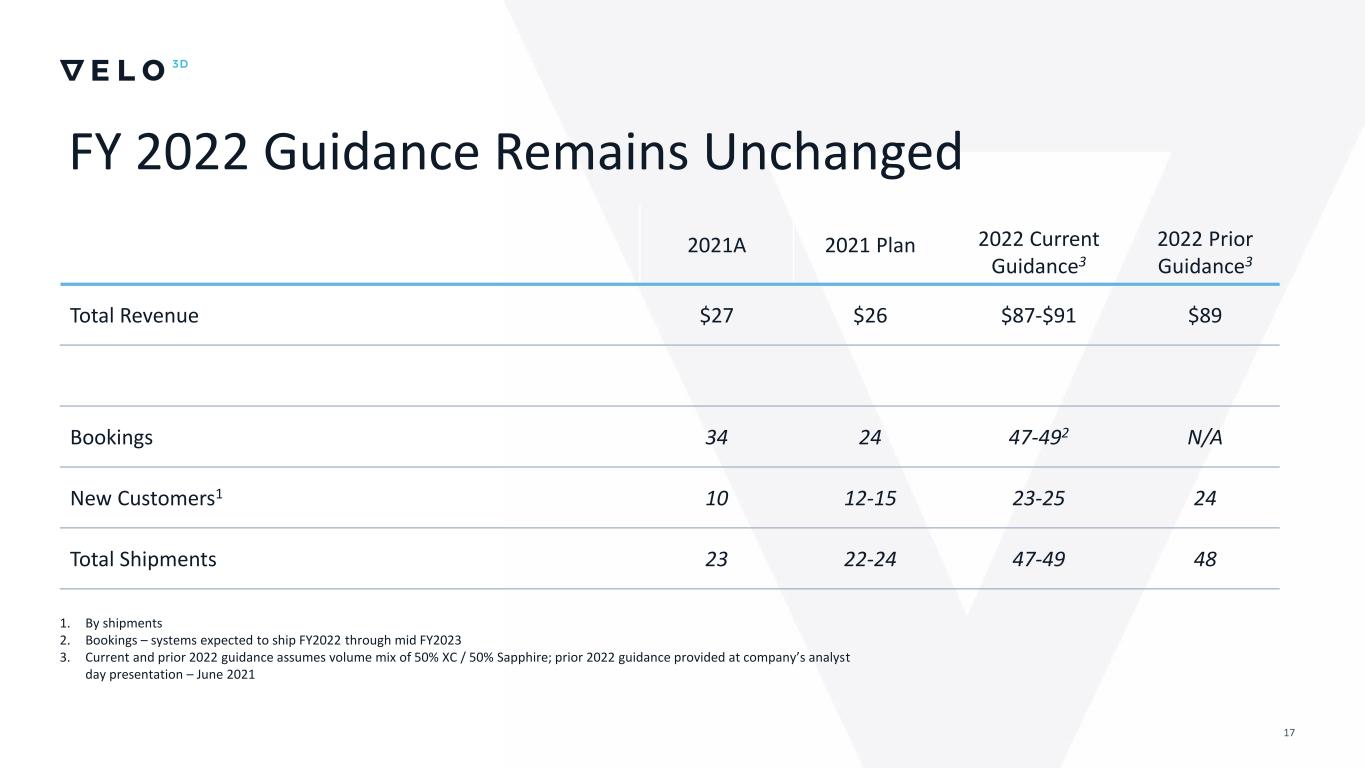
17 FY 2022 Guidance Remains Unchanged 1. By shipments 2. Bookings – systems expected to ship FY2022 through mid FY2023 3. Current and prior 2022 guidance assumes volume mix of 50% XC / 50% Sapphire; prior 2022 guidance provided at company’s analyst day presentation – June 2021 2021A 2021 Plan 2022 Current Guidance3 2022 Prior Guidance3 Total Revenue $27 $26 $87-$91 $89 Bookings 34 24 47-492 N/A New Customers1 10 12-15 23-25 24 Total Shipments 23 22-24 47-49 48

Confidential & Proprietary | 18 Q&A
+ 1 ( 4 0 8 ) 6 1 0 - 3 9 1 5 info@velo3d.com 511 Division St. Campbell, CA 95008 Appendix
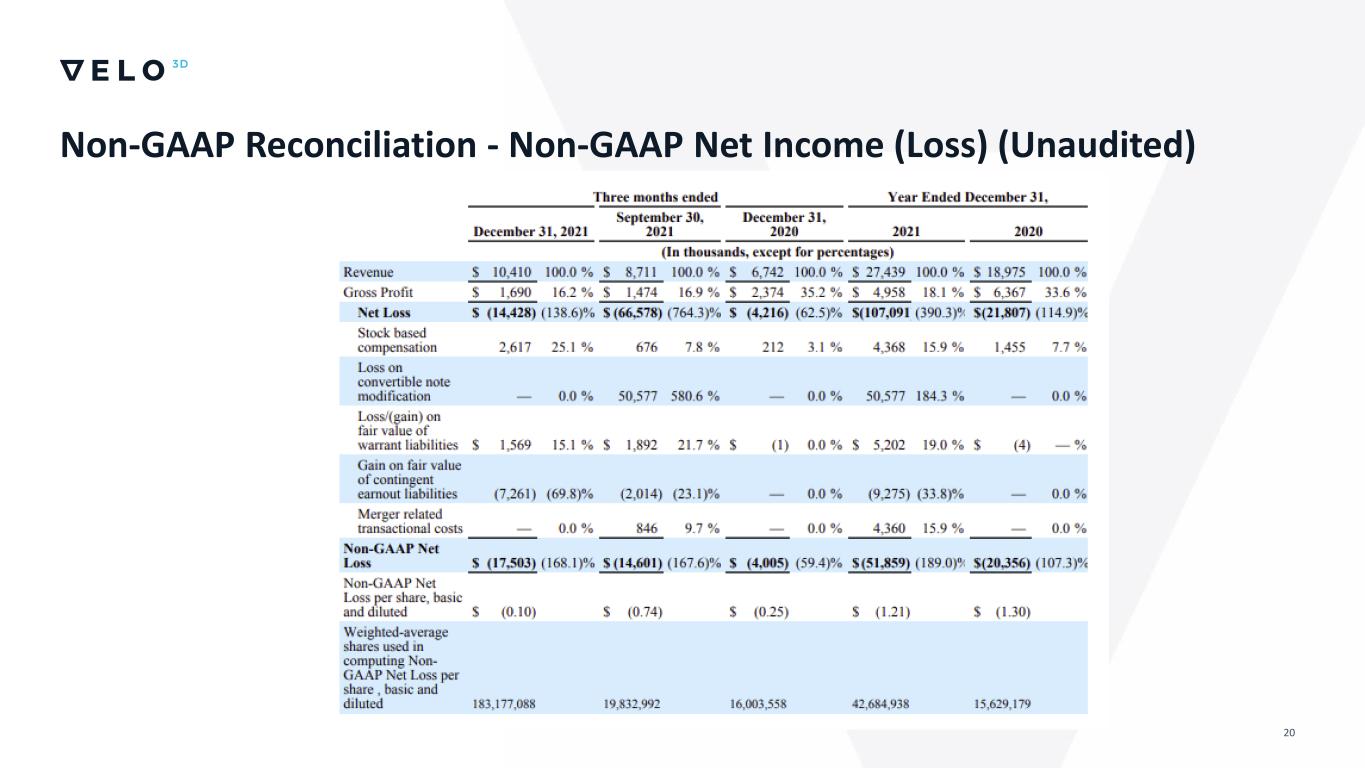
20 Non-GAAP Reconciliation - Non-GAAP Net Income (Loss) (Unaudited)
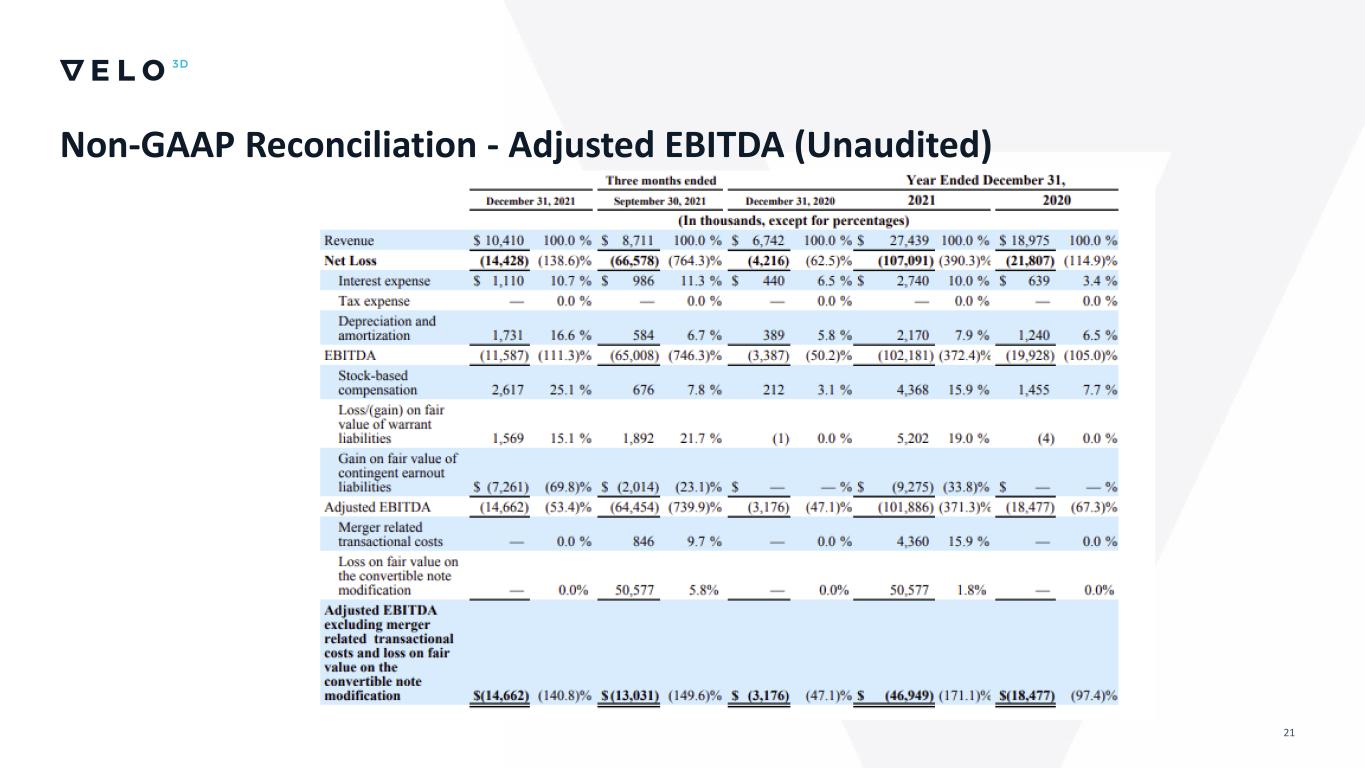
21 Non-GAAP Reconciliation - Adjusted EBITDA (Unaudited)
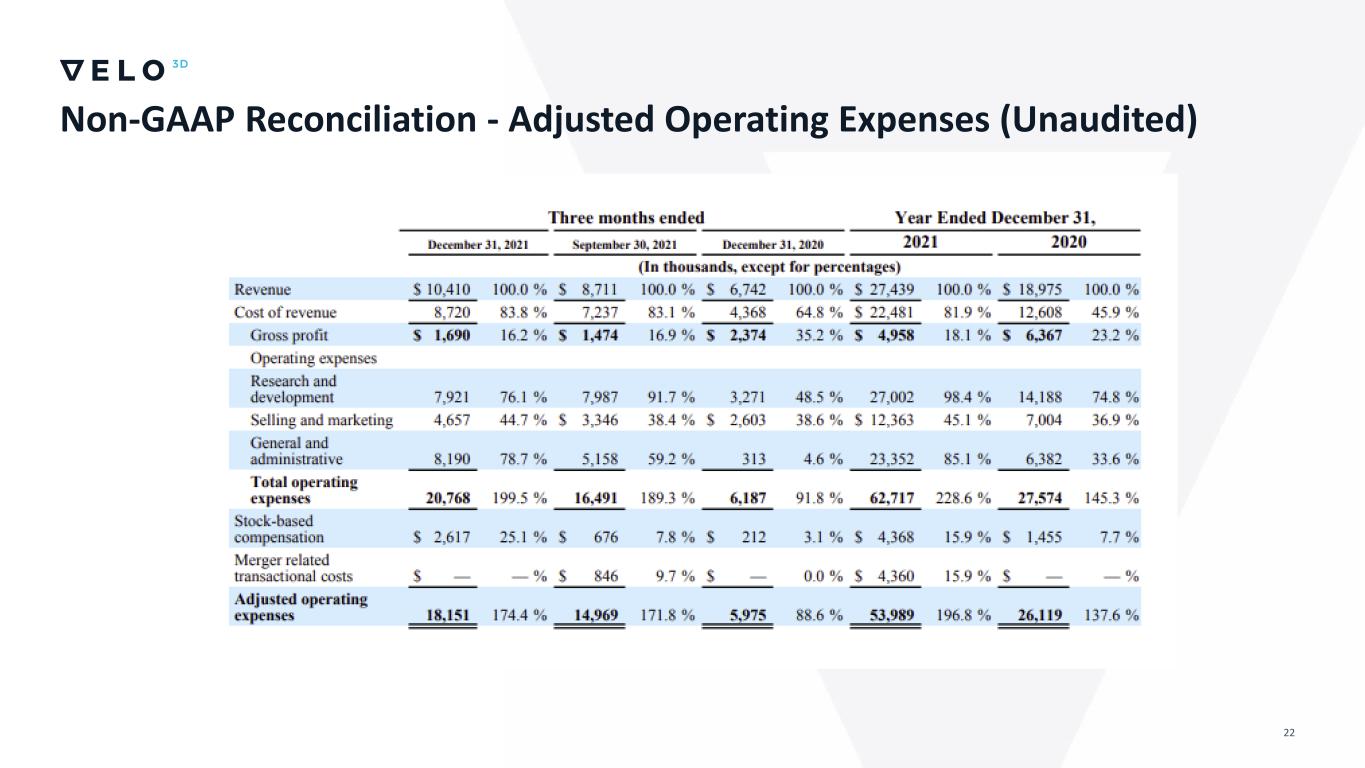
22 Non-GAAP Reconciliation - Adjusted Operating Expenses (Unaudited)
23 Disclaimer Industry and Market Data In this presentation, the Company relies on and refers to publicly available information and statistics regarding the market in which the Company competes and other industry data. The Company obtained this information and statistics from third-party sources, including reports by market research firms and company filings. While the Company believes such third-party information is reliable, there can be no assurance as to the accuracy or completeness of the indicated information. The Company has not independently verified the information provided by third-party sources. Trademarks This presentation may contain trademarks, service marks, trade names and copyrights of other companies, which are the property of the respective owners. Solely for convenience, some of the trademarks, service marks, trade names and copyrights referred to in this presentation may be listed without the TM, SM, © or ® symbols, but the Company will assert, to the fullest extent under applicable law, the rights of the applicable owners, if any, to these trademarks, service marks, trade names and copyrights. Non-GAAP Financial Information The Company uses non-GAAP financial measures, such as Adjusted operating expenses, EBITDA, Adjusted EBITDA, Adjusted EBITDA excluding merger costs and loss on convertible note extinguishment, and Non-GAAP net income (loss), to help it make strategic decisions, establish budgets and operational goals for managing its business, analyze its financial results and evaluate its performance. The Company also believes that the presentation of these non-GAAP financial measures in this presentation provides an additional tool for investors to use in comparing the Company’s core business and results of operations over multiple periods. However, the non-GAAP financial measures presented in this presentation may not be comparable to similarly titled measures reported by other companies due to differences in the way that these measures are calculated. The non-GAAP financial measures presented in this presentation should not be considered as the sole measure of the Company’s performance and should not be considered in isolation from, or as a substitute for, comparable financial measures calculated in accordance with generally accepted accounting principles accepted in the United States (“GAAP”). For reconciliations of these non-GAAP financial measures to the Company’s GAAP financial measures, see the Appendix to this presentation. You should review these reconciliations and not rely on any single financial measure to evaluate the Company business.
Fourth Quarter 2021 Supplementary Slides Without Compromise M a r c h 2 , 2 0 2 2