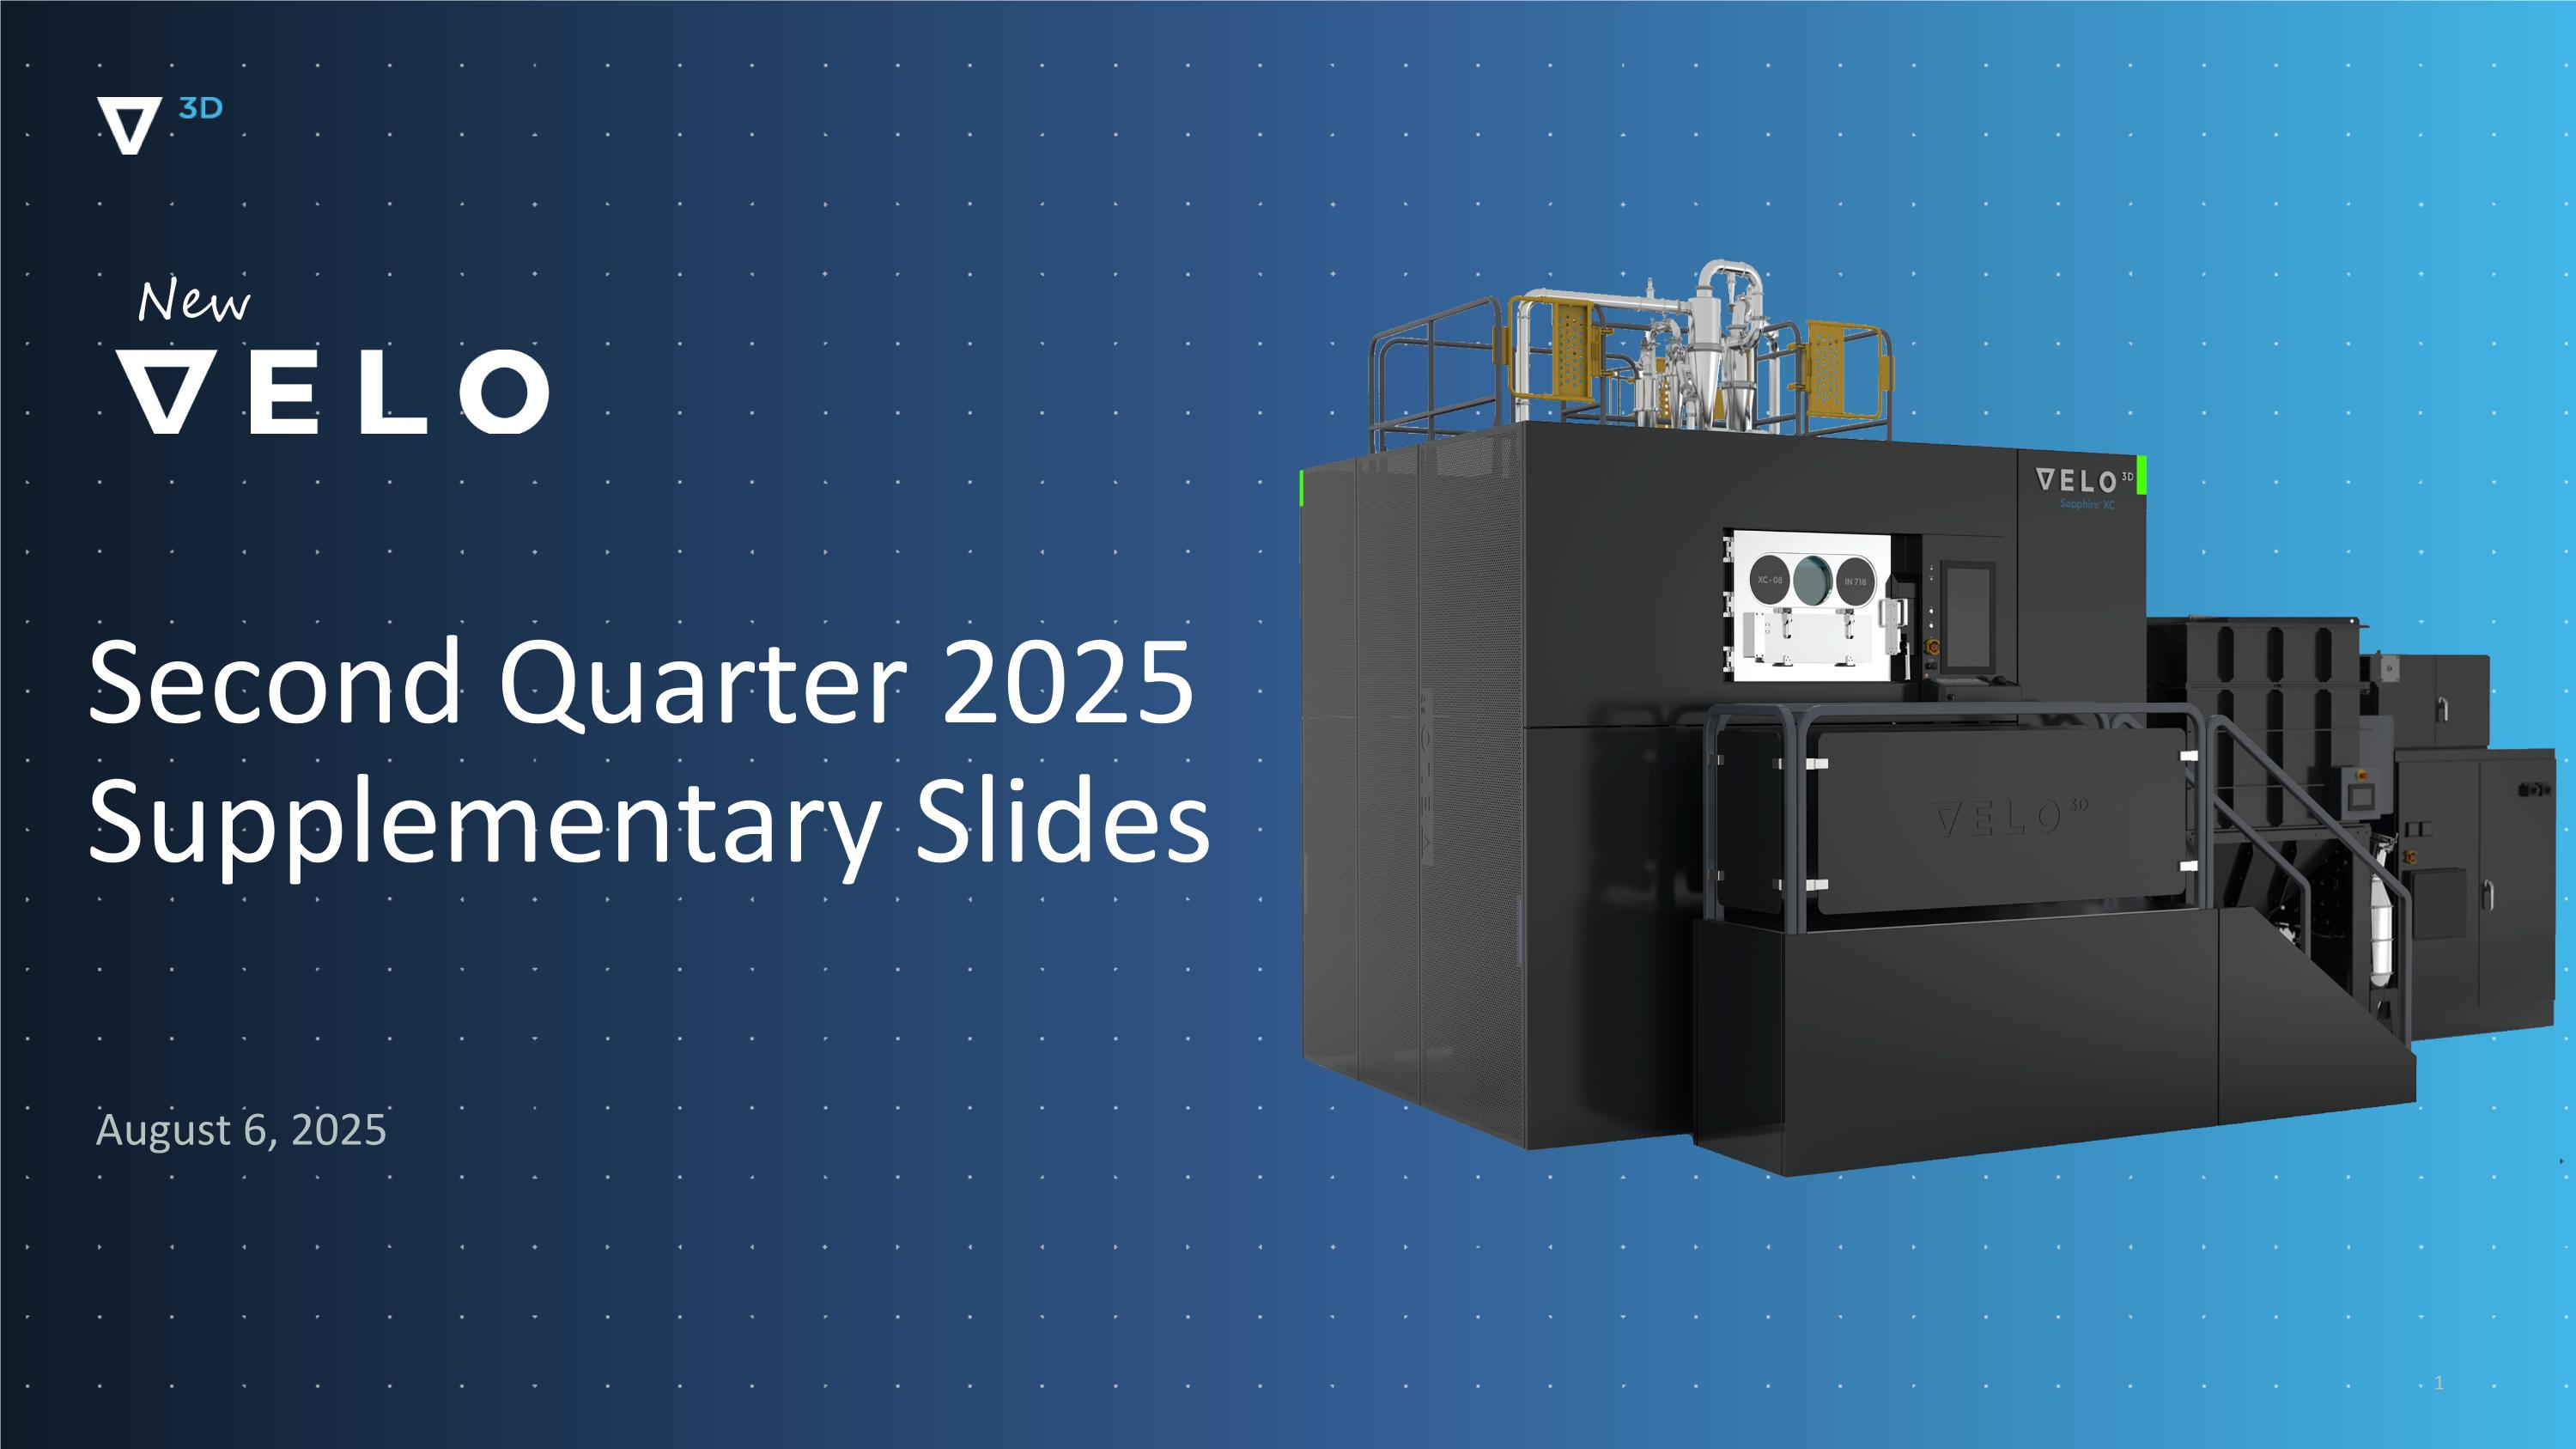

Second Quarter 2025 Supplementary Slides August 6, 2025 New
Confidential & Proprietary | Disclaimer Forward Looking Statement This presentation includes “forward-looking statements” within the meaning of the “safe harbor” provisions of the Private Securities Litigation Reform Act of 1996. The company’s actual results may differ from its expectations, estimates and projections and consequently, you should not rely on these forward-looking statements as predictions of future events. Words such as “expect”, “estimate”, “project”, “budget”, “forecast”, “anticipate”, “intend”, “plan”, “may”, “will”, “could”, “should”, “believes”, “predicts”, “potential”, “continue”, and similar expressions are intended to identify such forward-looking statements. These forward-looking statements include, without limitation, the company’s guidance for fiscal years 2025 and 2026 (including the company’s estimates for revenue and gross margin), the company's expectations regarding its ability to achieve profitability in the first half of 2026, the company’s expectations about future demand, the company's strategic realignment and initiatives, the company’s expectations regarding its liquidity and capital requirements, the company’s expectations regarding its potential cost savings, the company’s expectation about its market strategy and financial and operational position, and the company’s other expectations, hopes, beliefs, intentions or strategies for the future. These forward-looking statements involve significant risks and uncertainties that could cause the actual results to differ materially from the expected results. You should carefully consider the risks and uncertainties described in the “Risk Factors” section of the company’s Annual Report on Form 10-K for the fiscal year ended December 31, 2024 (the “FY 2024 10-K”) and the other documents filed by the company from time to time with the SEC. These filings identify and address other important risks and uncertainties that could cause actual events and results to differ materially from those contained in the forward-looking statements. Most of these factors are outside the company’s control and are difficult to predict. Factors that may cause such differences include, but are not limited to: (1) the inability of the company to execute its business plan, which may be affected by, among other things, competition, the ability of the company to grow and manage growth profitably, maintain relationships with customers and suppliers and retain its key employees; (2) the company’s ability to continue as a going concern; (3) the company’s ability to service and comply with its indebtedness; (4) the company’s ability to raise additional capital in the near-term; (5) the possibility that the company may be adversely affected by other economic, business, and/or competitive factors; (6) changes in the applicable laws and regulations, and (7) other risks and uncertainties indicated from time to time described in the FY 2024 10-K, including those under “Risk Factors” therein, and in the company’s other filings with the SEC. The company cautions that the foregoing list of factors is not exclusive and not to place undue reliance upon any forward-looking statements, including projections, which speak only as of the date made. The company does not undertake or accept any obligation to release publicly any updates or revisions to any forward-looking statements to reflect any change in its expectations or any change in events, conditions or circumstances on which any such statement is based. * Additional information on the use of Non-GAAP financial information, industry and market data, and trademarks is included in the appendix of this presentation.
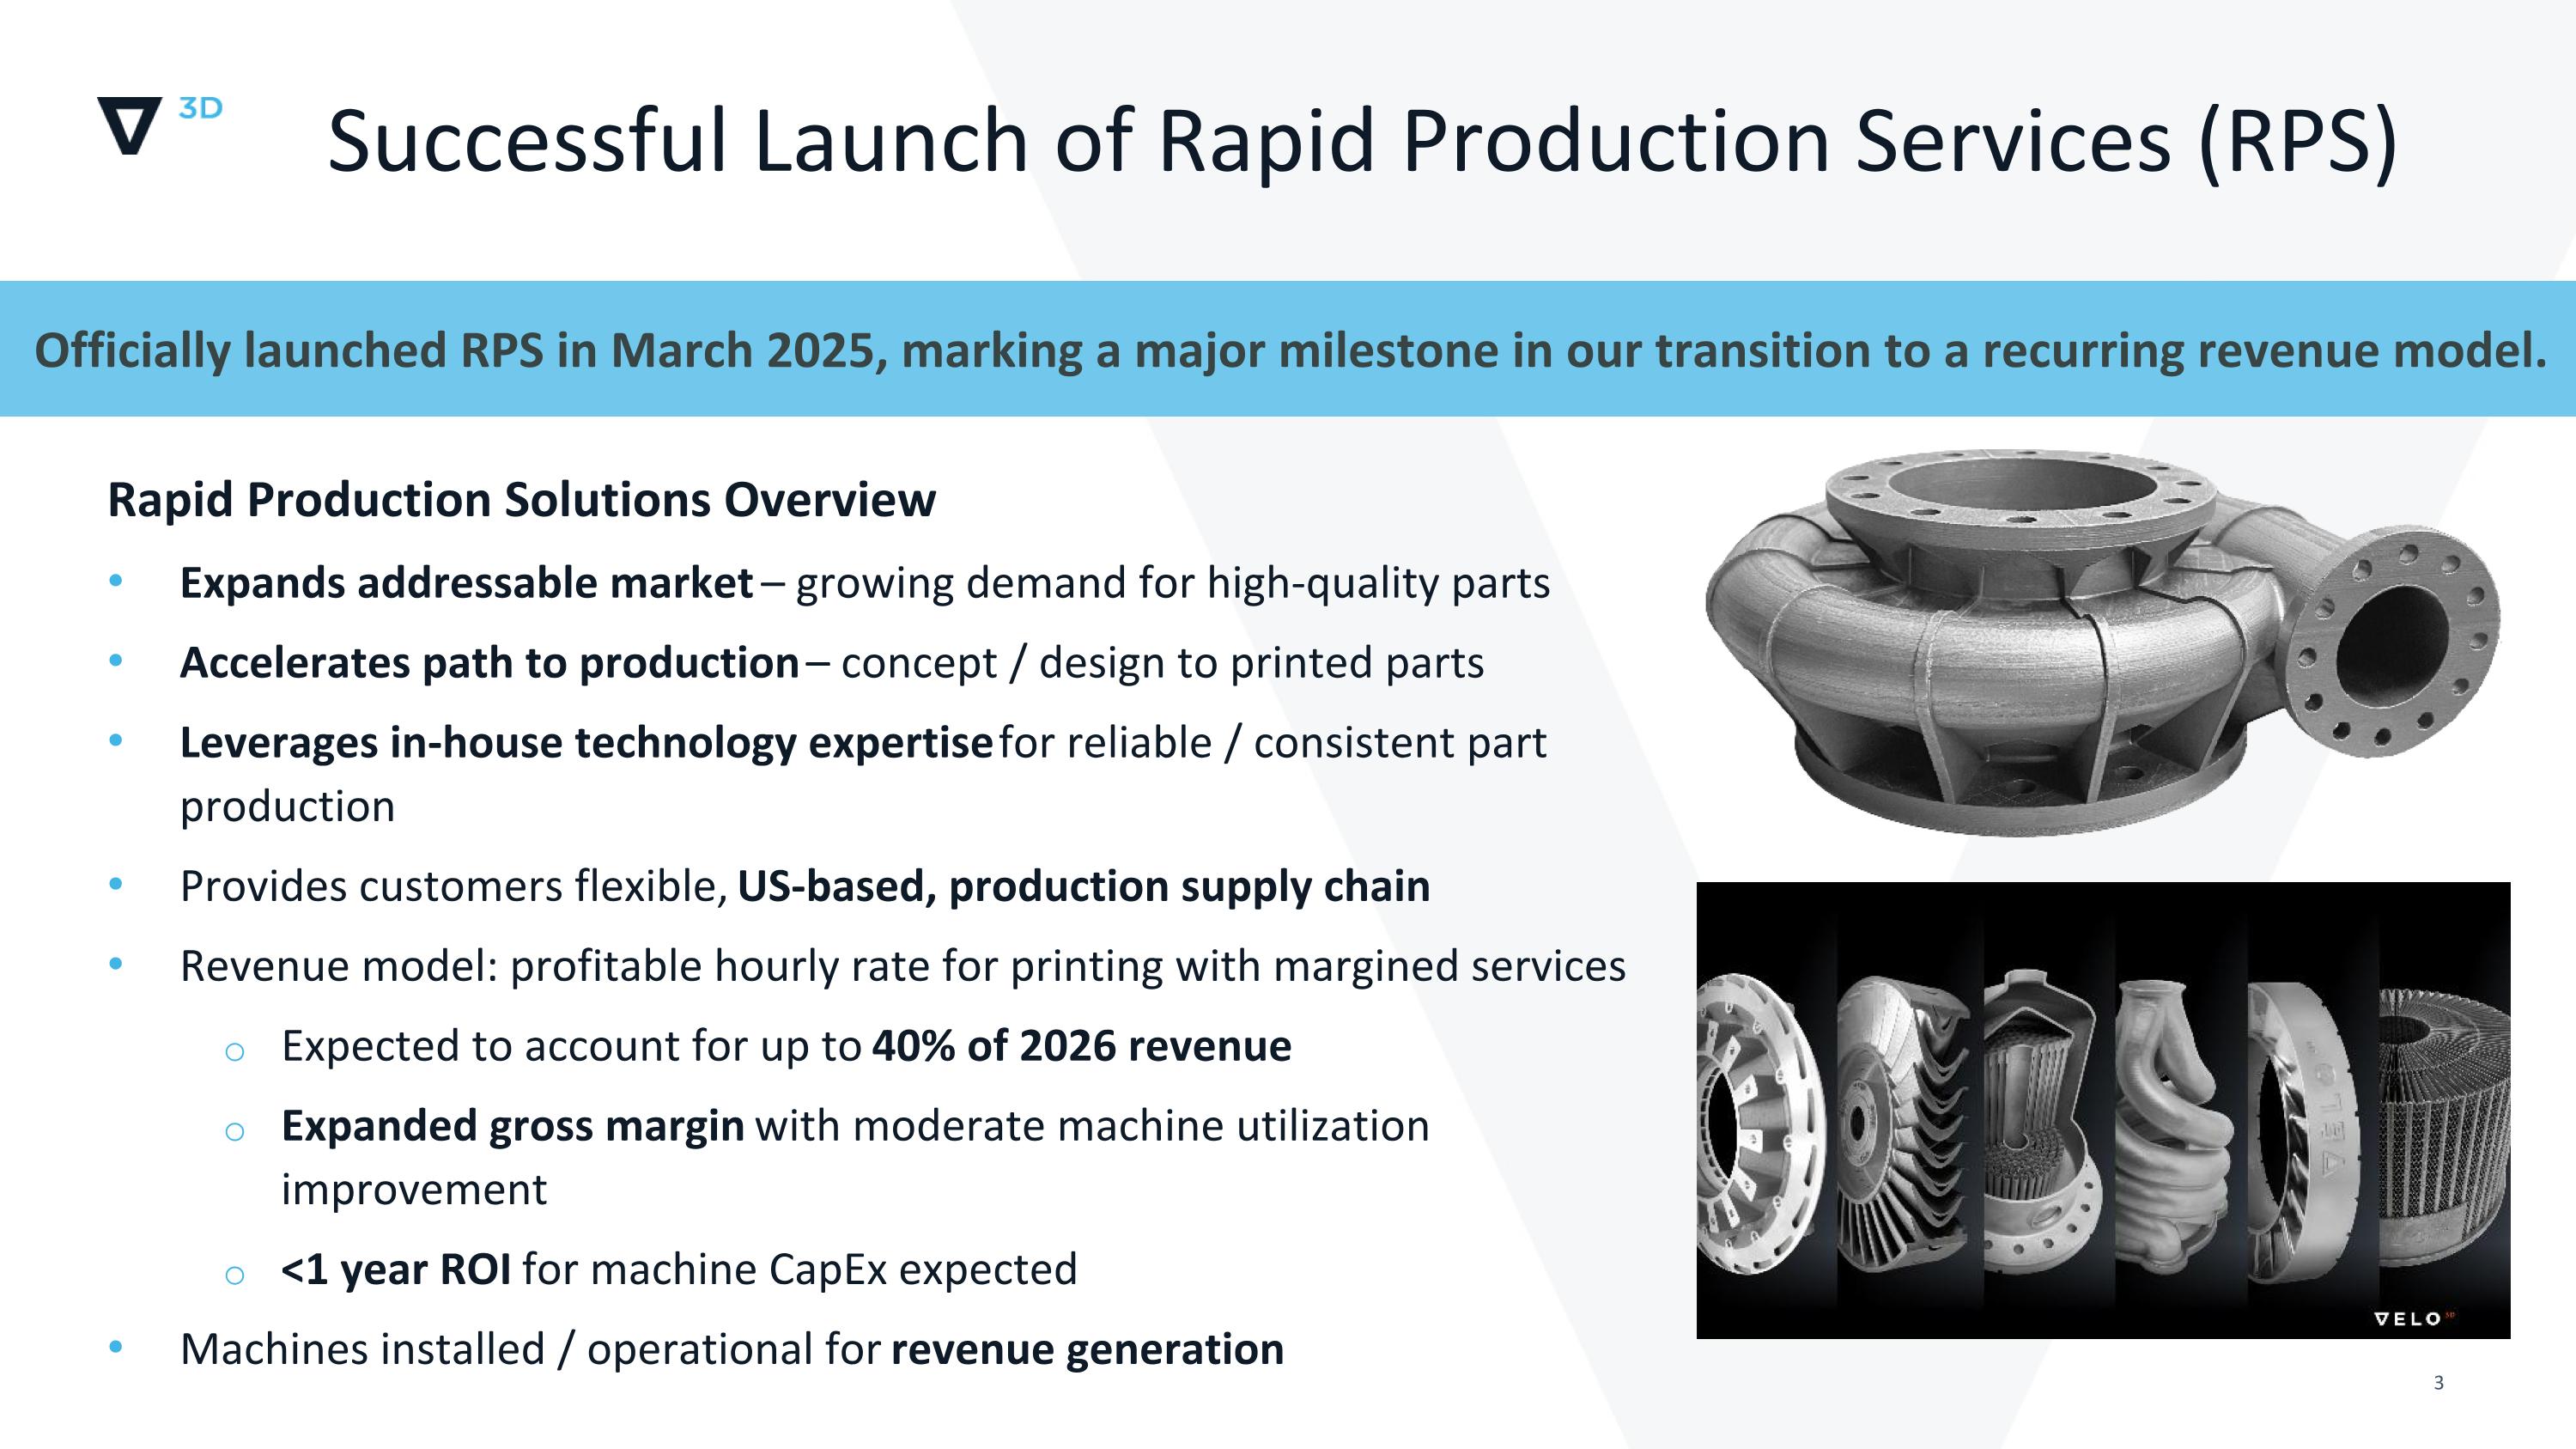
Successful Launch of Rapid Production Services (RPS) Rapid Production Solutions Overview Expands addressable market – growing demand for high-quality parts Accelerates path to production – concept / design to printed parts Leverages in-house technology expertise for reliable / consistent part production Provides customers flexible, US-based, production supply chain Revenue model: profitable hourly rate for printing with margined services Expected to account for up to 40% of 2026 revenue Expanded gross margin with moderate machine utilization improvement <1 year ROI for machine CapEx expected Machines installed / operational for revenue generation Officially launched RPS in March 2025, marking a major milestone in our transition to a recurring revenue model.
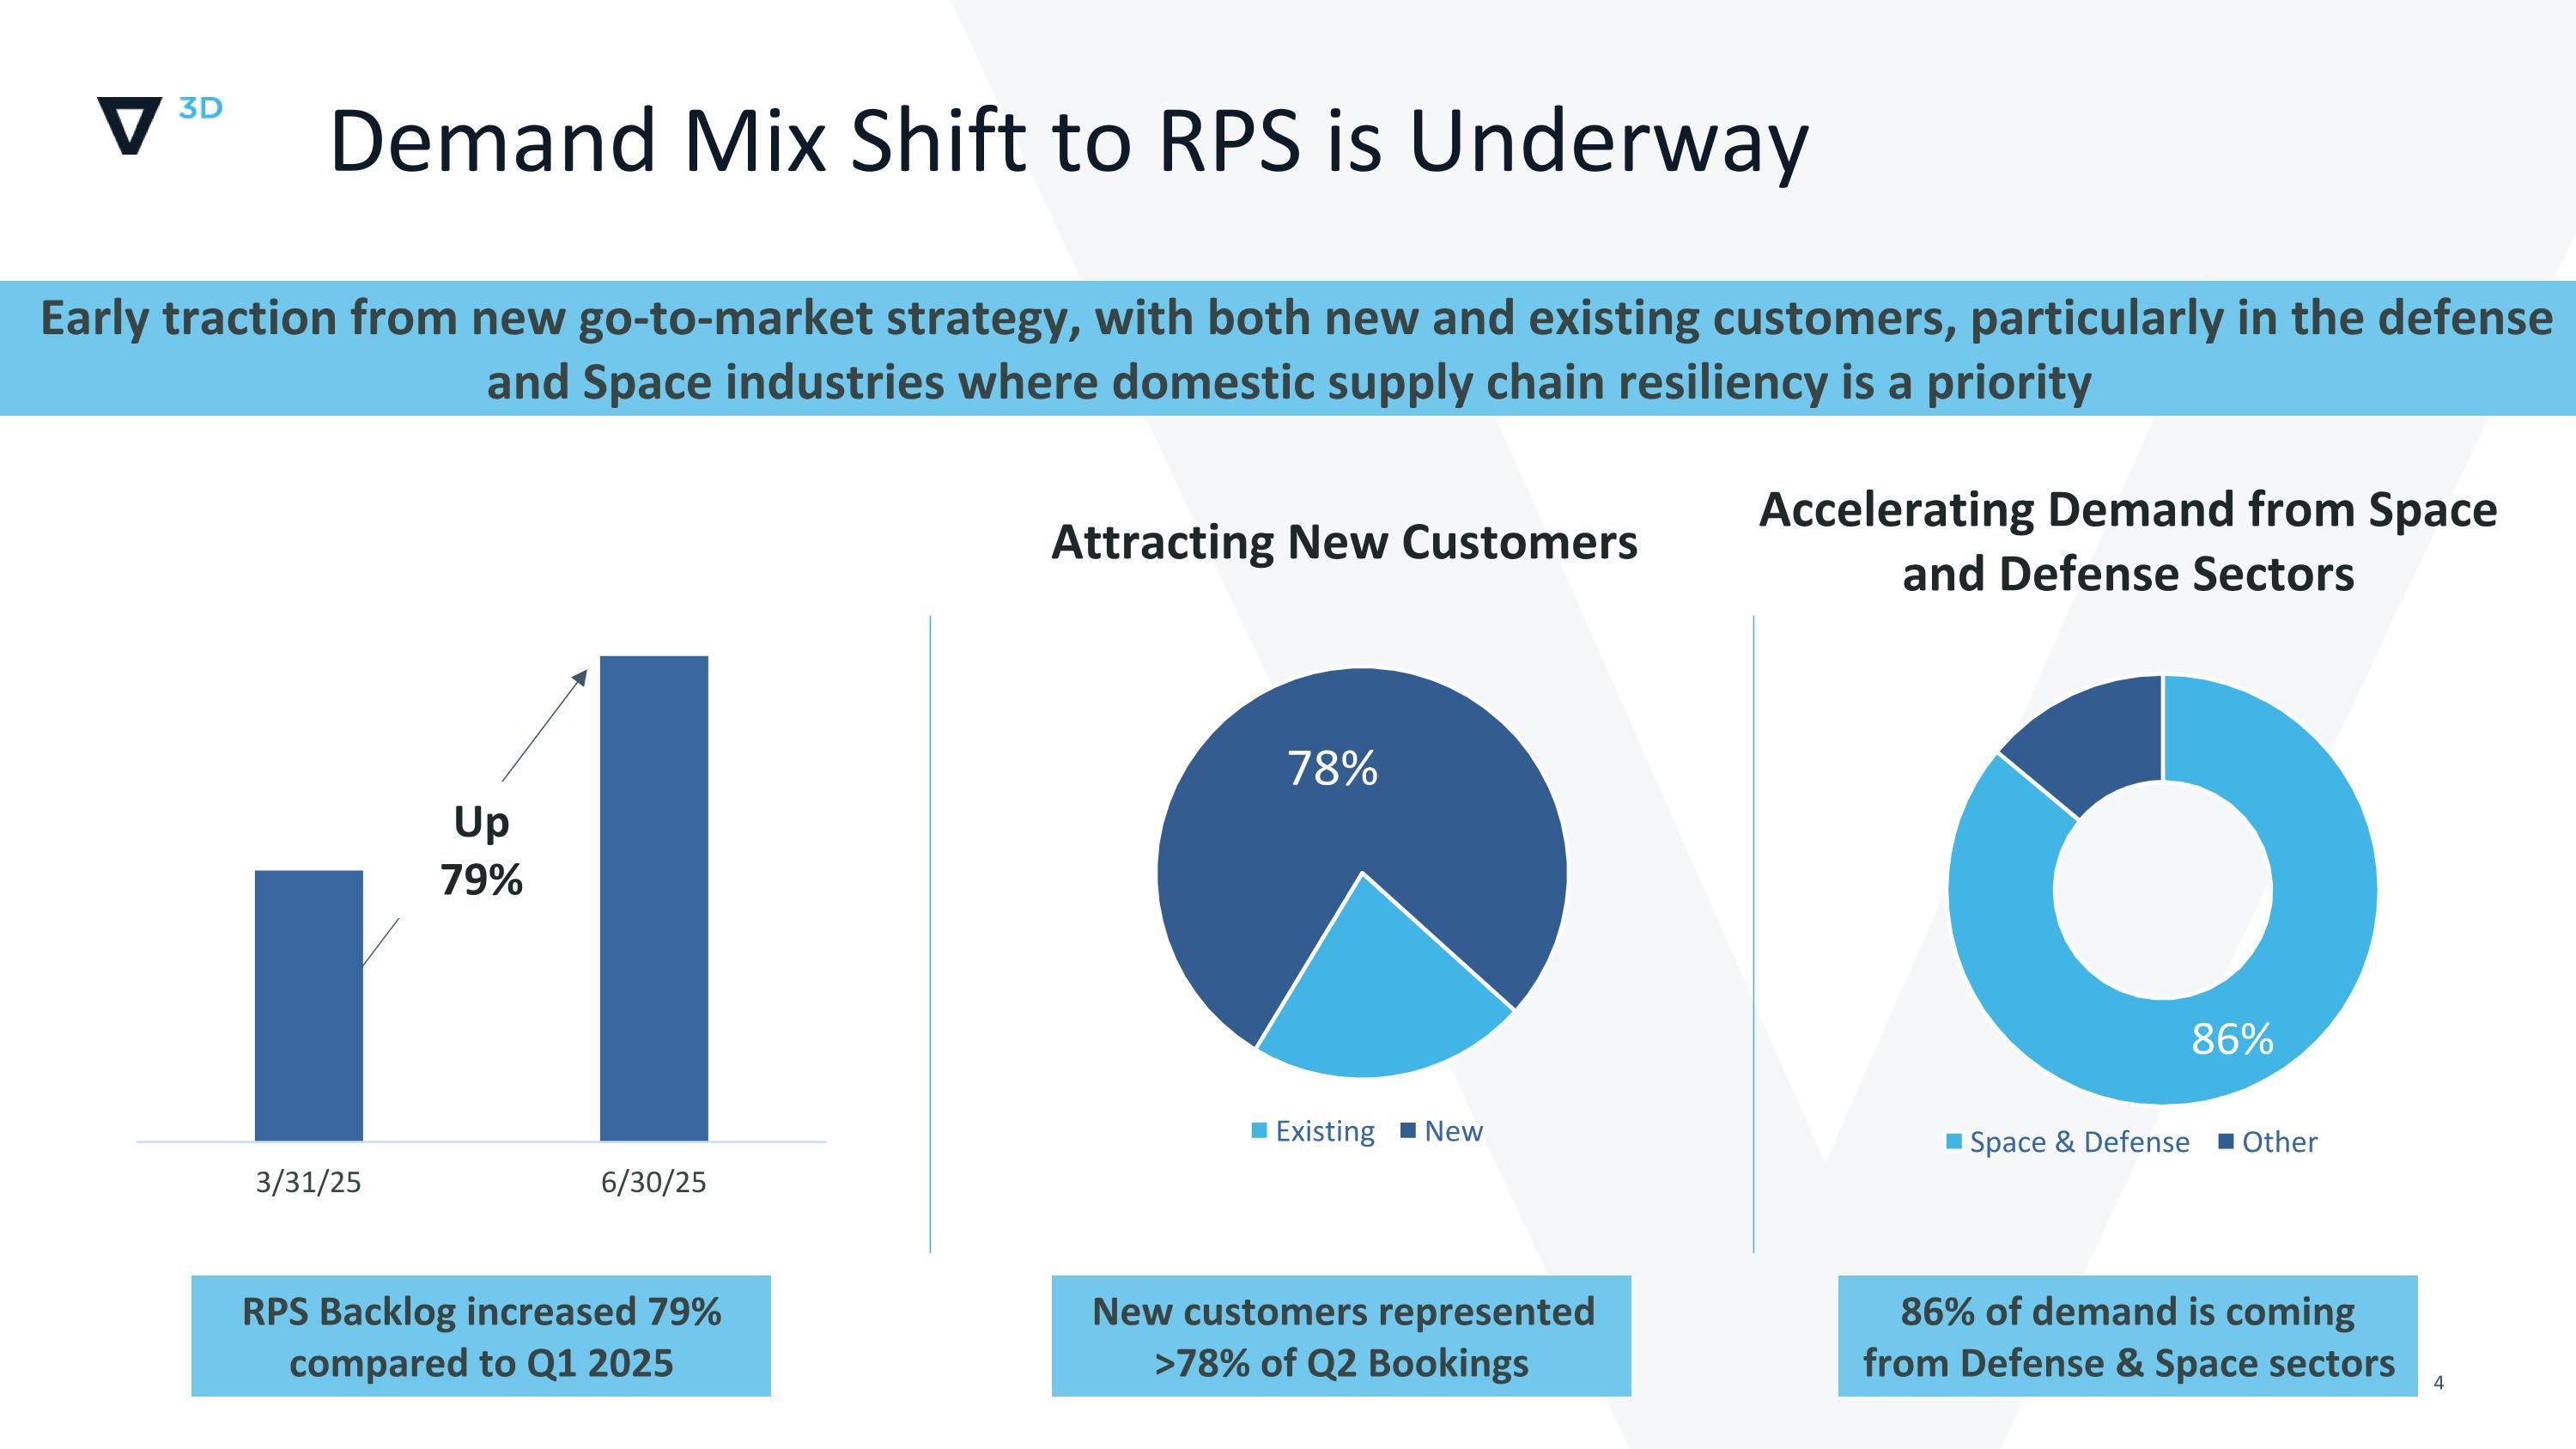
Early traction from new go-to-market strategy, with both new and existing customers, particularly in the defense and Space industries where domestic supply chain resiliency is a priority Demand Mix Shift to RPS is Underway Up 79% Attracting New Customers Accelerating Demand from Space and Defense Sectors RPS Backlog increased 79% compared to Q1 2025 New customers represented >78% of Q2 Bookings 86% of demand is coming from Defense & Space sectors
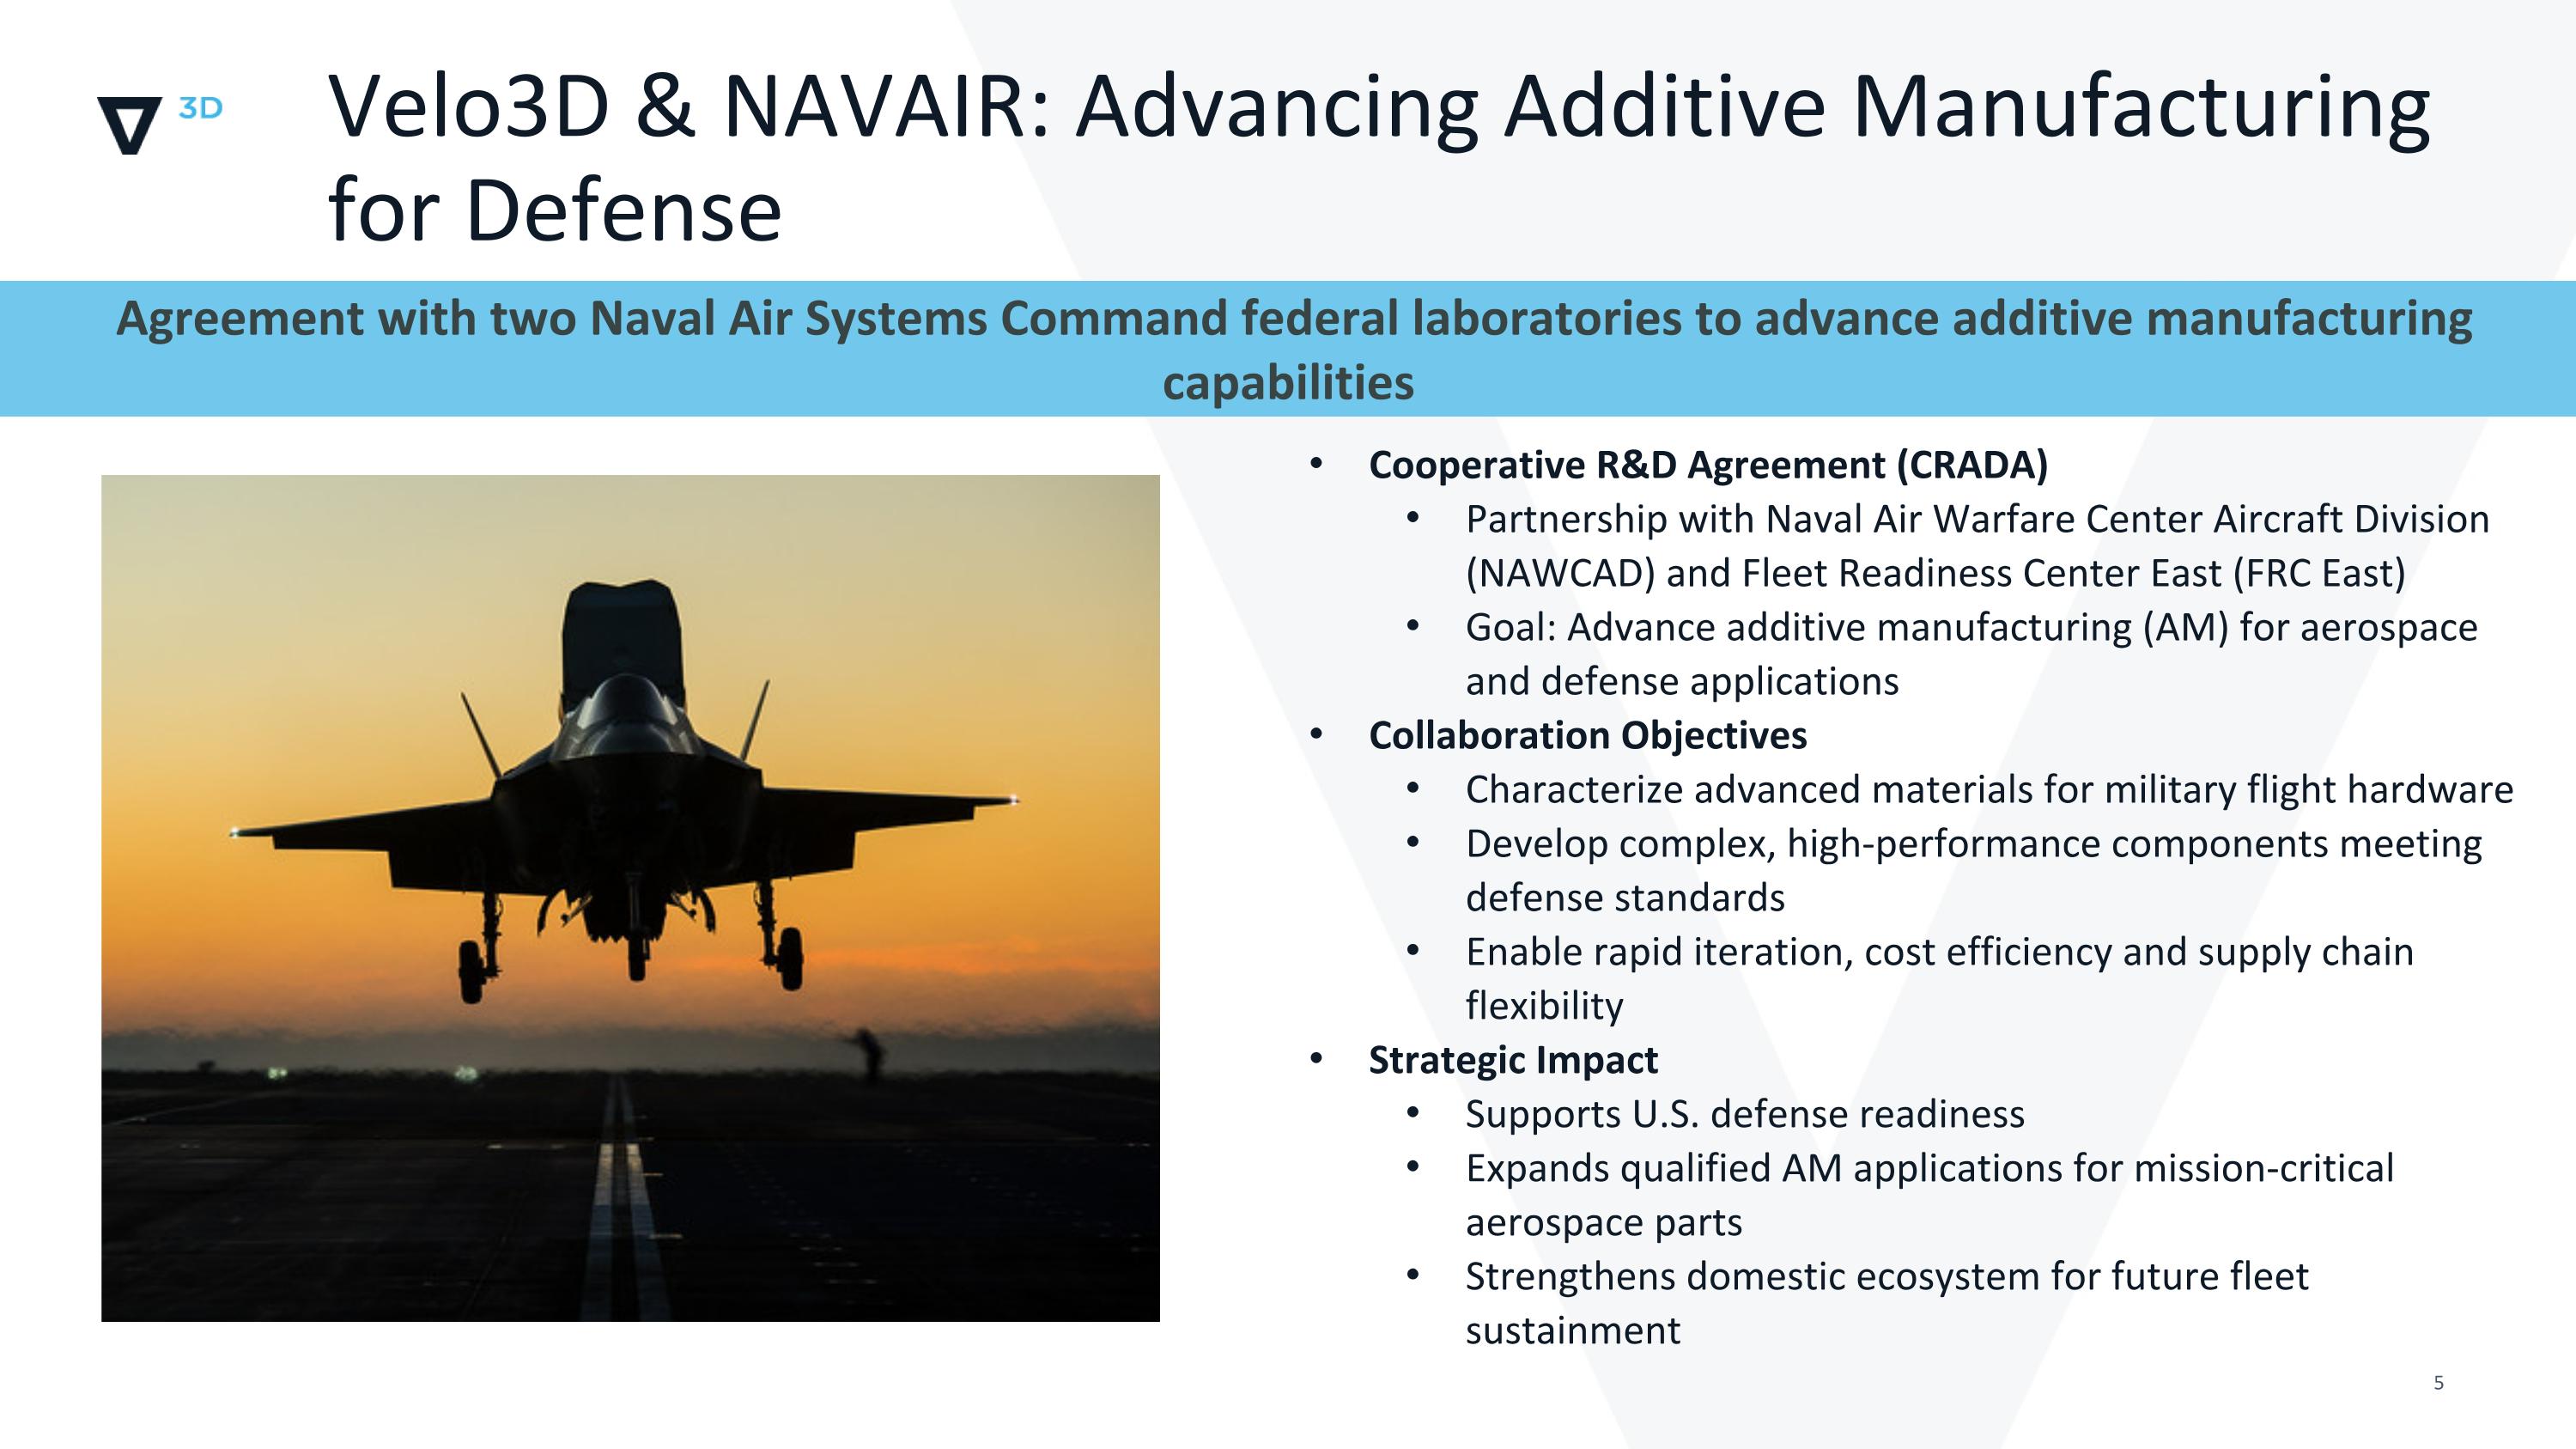
Velo3D & NAVAIR: Advancing Additive Manufacturing for Defense Agreement with two Naval Air Systems Command federal laboratories to advance additive manufacturing capabilities Cooperative R&D Agreement (CRADA) Partnership with Naval Air Warfare Center Aircraft Division (NAWCAD) and Fleet Readiness Center East (FRC East) Goal: Advance additive manufacturing (AM) for aerospace and defense applications Collaboration Objectives Characterize advanced materials for military flight hardware Develop complex, high-performance components meeting defense standards Enable rapid iteration, cost efficiency and supply chain flexibility Strategic Impact Supports U.S. defense readiness Expands qualified AM applications for mission-critical aerospace parts Strengthens domestic ecosystem for future fleet sustainment
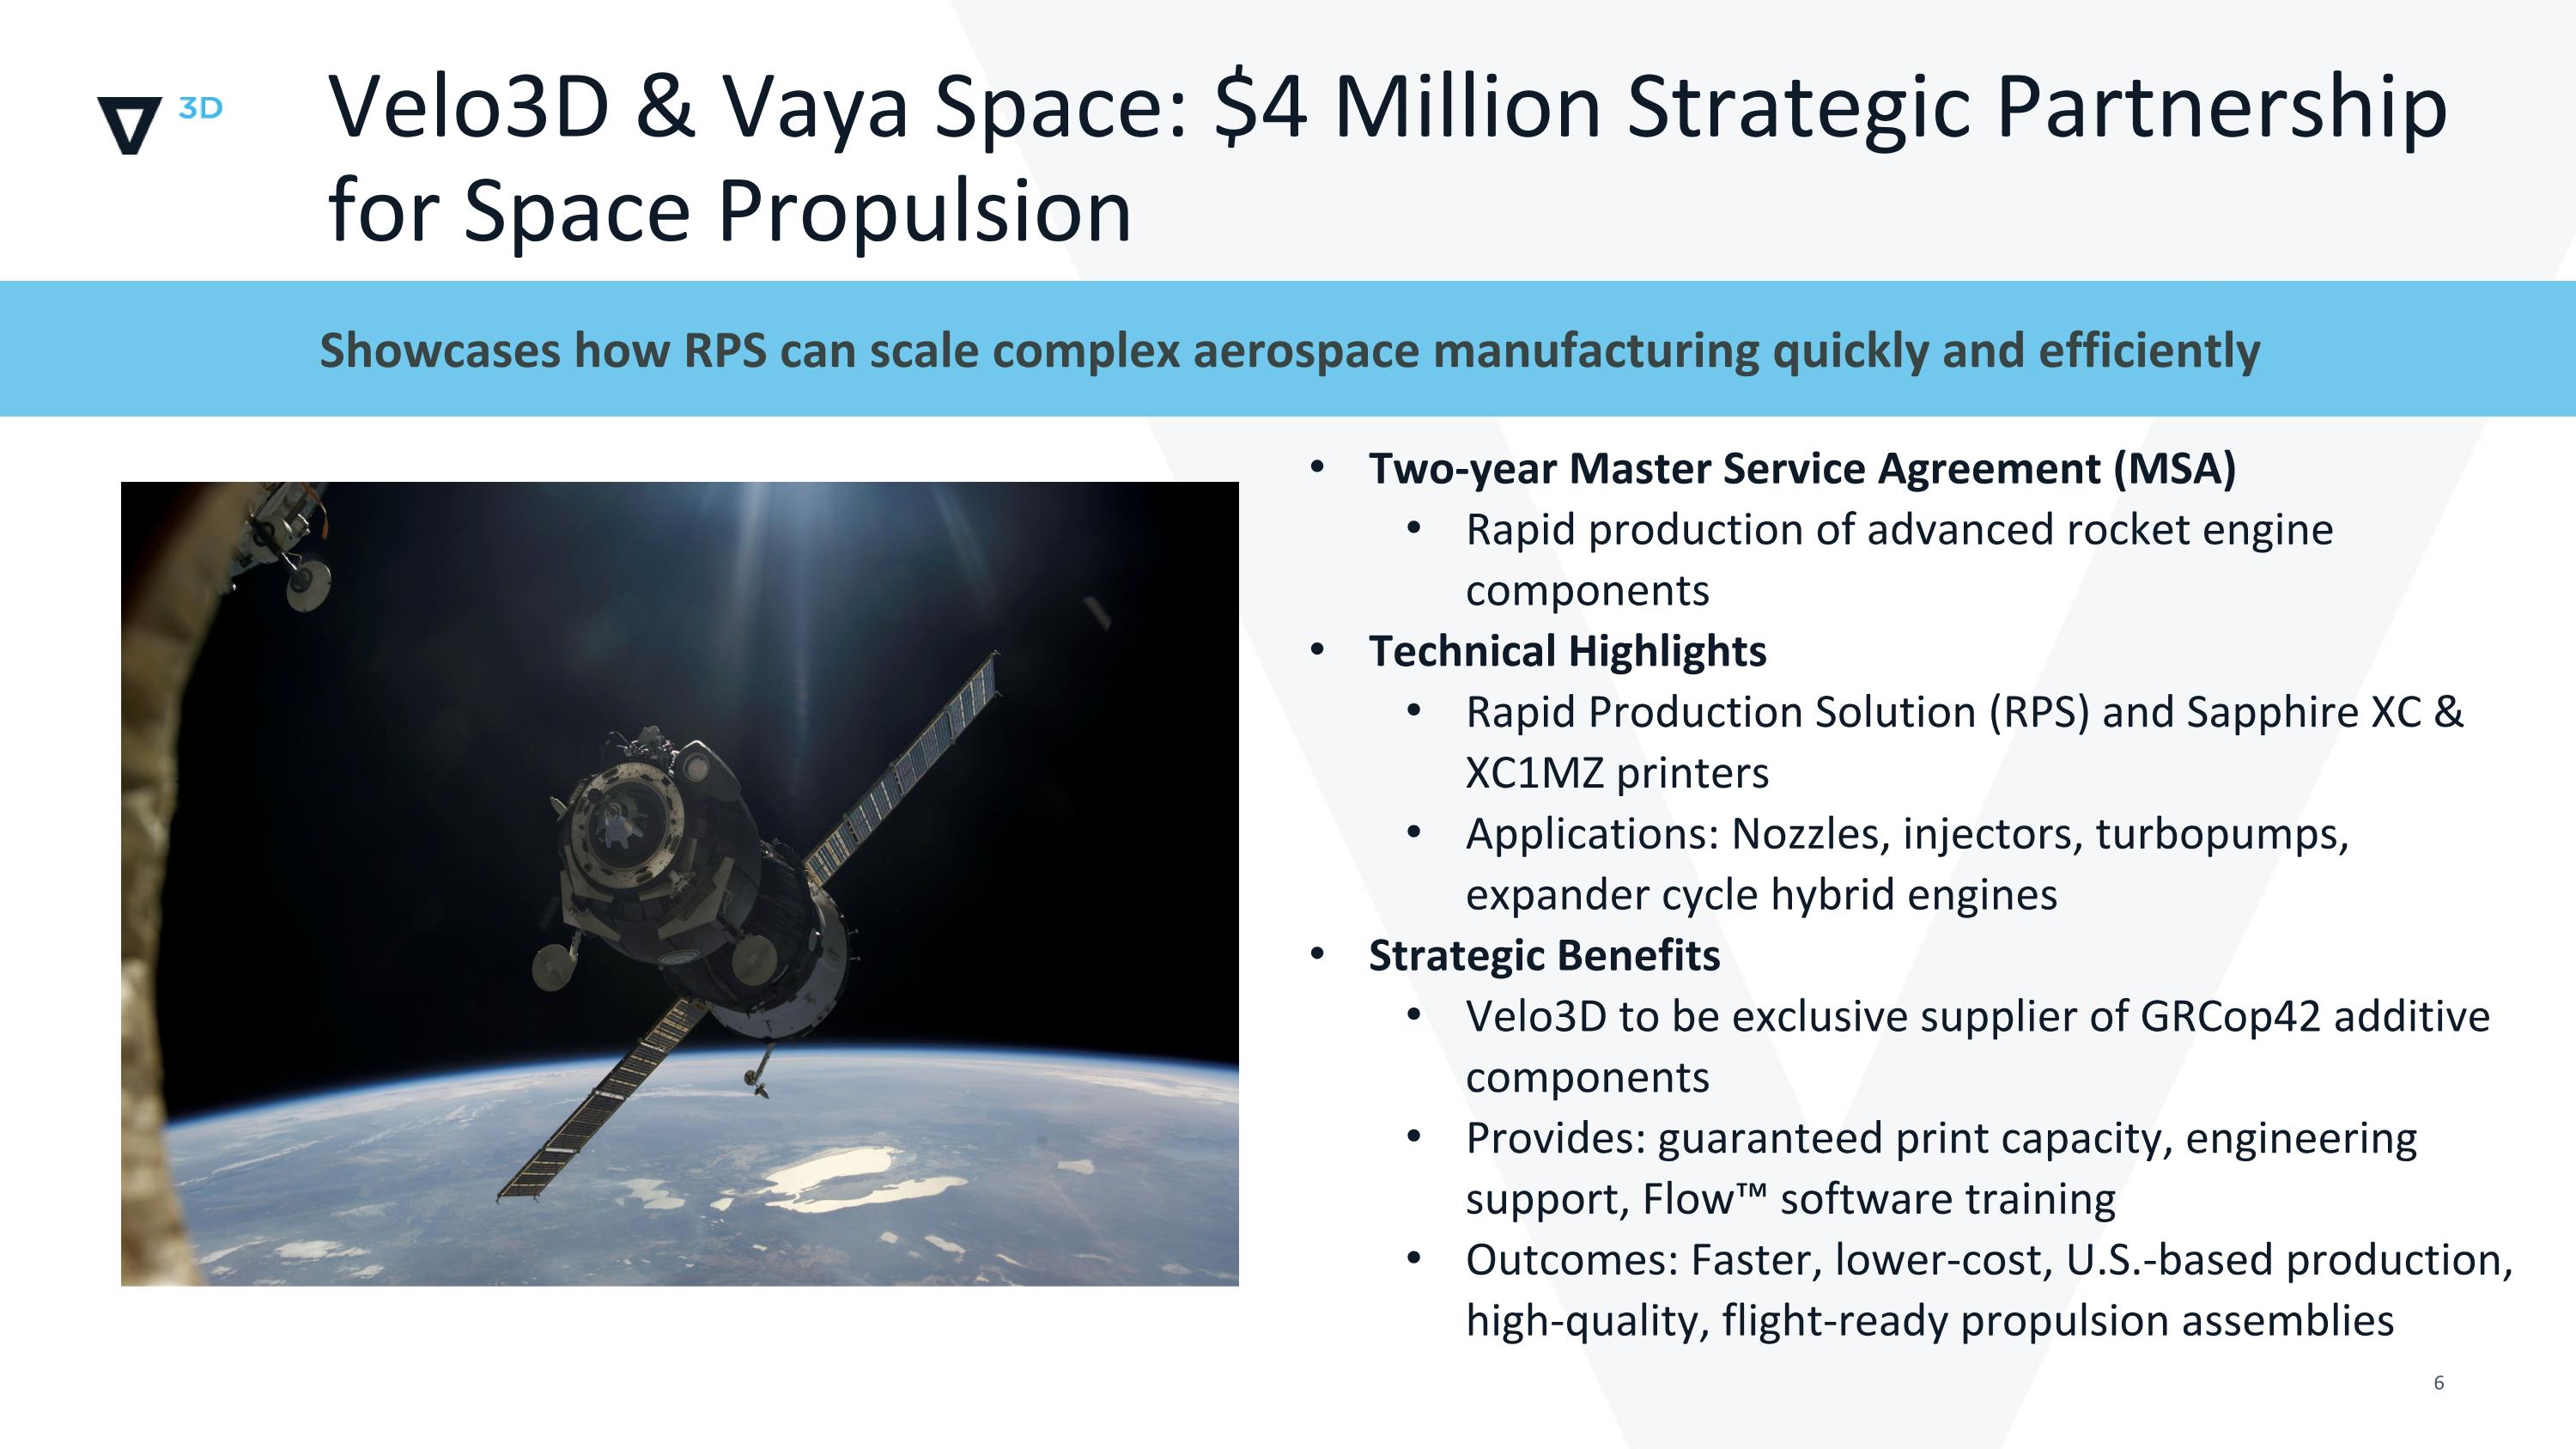
Velo3D & Vaya Space: $4 Million Strategic Partnership for Space Propulsion Showcases how RPS can scale complex aerospace manufacturing quickly and efficiently Two-year Master Service Agreement (MSA) Rapid production of advanced rocket engine components Technical Highlights Rapid Production Solution (RPS) and Sapphire XC & XC1MZ printers Applications: Nozzles, injectors, turbopumps, expander cycle hybrid engines Strategic Benefits Velo3D to be exclusive supplier of GRCop42 additive components Provides: guaranteed print capacity, engineering support, Flow™ software training Outcomes: Faster, lower-cost, U.S.-based production, high-quality, flight-ready propulsion assemblies
Advancing Strategic Partnership with Amaero Material Qualification Milestone Achieved Confirming Conformance for Critical Applications Material Qualification Milestone Reached Auburn University’s NCAME validated Amaero’s powders for additive manufacturing C103 Niobium: Met ASTM F3635 Class B after 2200F heat treatment Ti-6AI-4V Titanium: Met AMS7015 and ASTM F3001 standards Strategic Collaboration Moving forward with system-specific material qualification for Sapphire printers Over 1,000 kg of powder to be delivered to Velo3D production floor in Q3 2025 Strengthening U.S. Manufacturing Supports critical aerospace and defense projects Accelerates efforts to build a resilient domestic AM ecosystem

Confidential & Proprietary | Financial Overview New
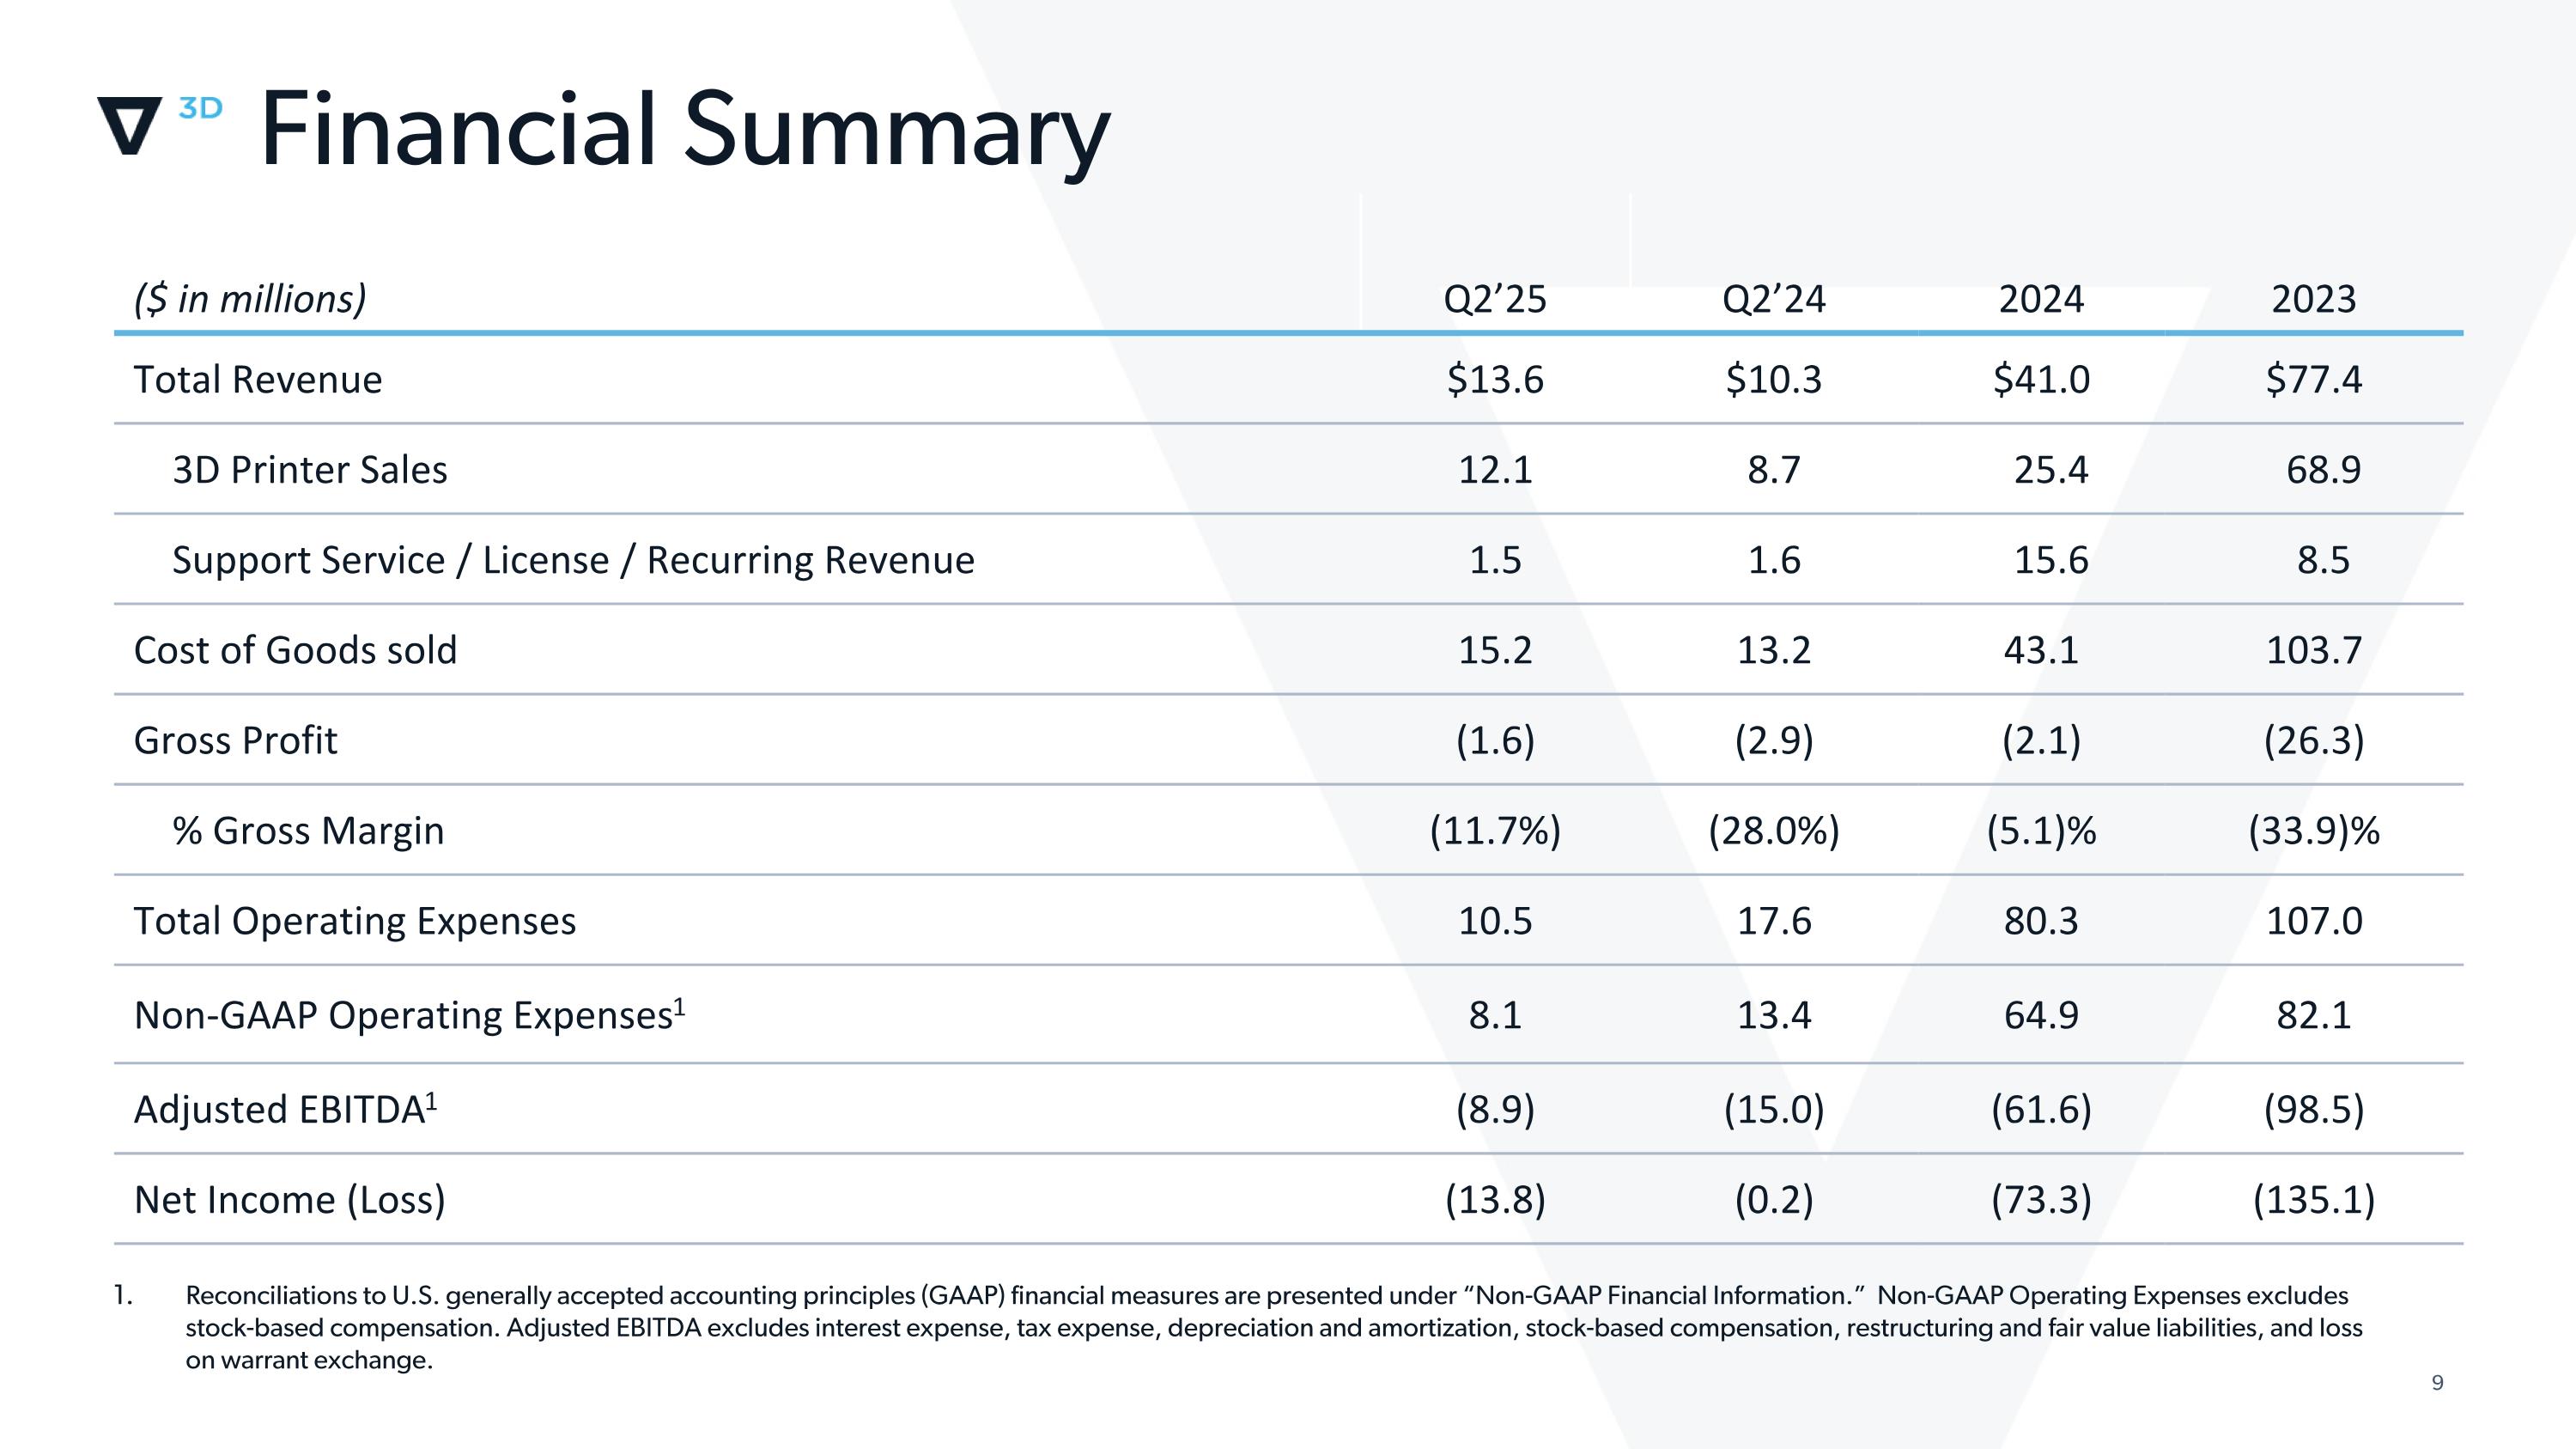
Financial Summary Reconciliations to U.S. generally accepted accounting principles (GAAP) financial measures are presented under “Non-GAAP Financial Information.” Non-GAAP Operating Expenses excludes stock-based compensation. Adjusted EBITDA excludes interest expense, tax expense, depreciation and amortization, stock-based compensation, restructuring and fair value liabilities, and loss on warrant exchange. ($ in millions) Q2’25 Q2’24 2024 2023 Total Revenue $13.6 $10.3 $41.0 $77.4 3D Printer Sales 12.1 8.7 25.4 68.9 Support Service / License / Recurring Revenue 1.5 1.6 15.6 8.5 Cost of Goods sold 15.2 13.2 43.1 103.7 Gross Profit (1.6) (2.9) (2.1) (26.3) % Gross Margin (11.7%) (28.0%) (5.1)% (33.9)% Total Operating Expenses 10.5 17.6 80.3 107.0 Non-GAAP Operating Expenses1 8.1 13.4 64.9 82.1 Adjusted EBITDA1 (8.9) (15.0) (61.6) (98.5) Net Income (Loss) (13.8) (0.2) (73.3) (135.1)
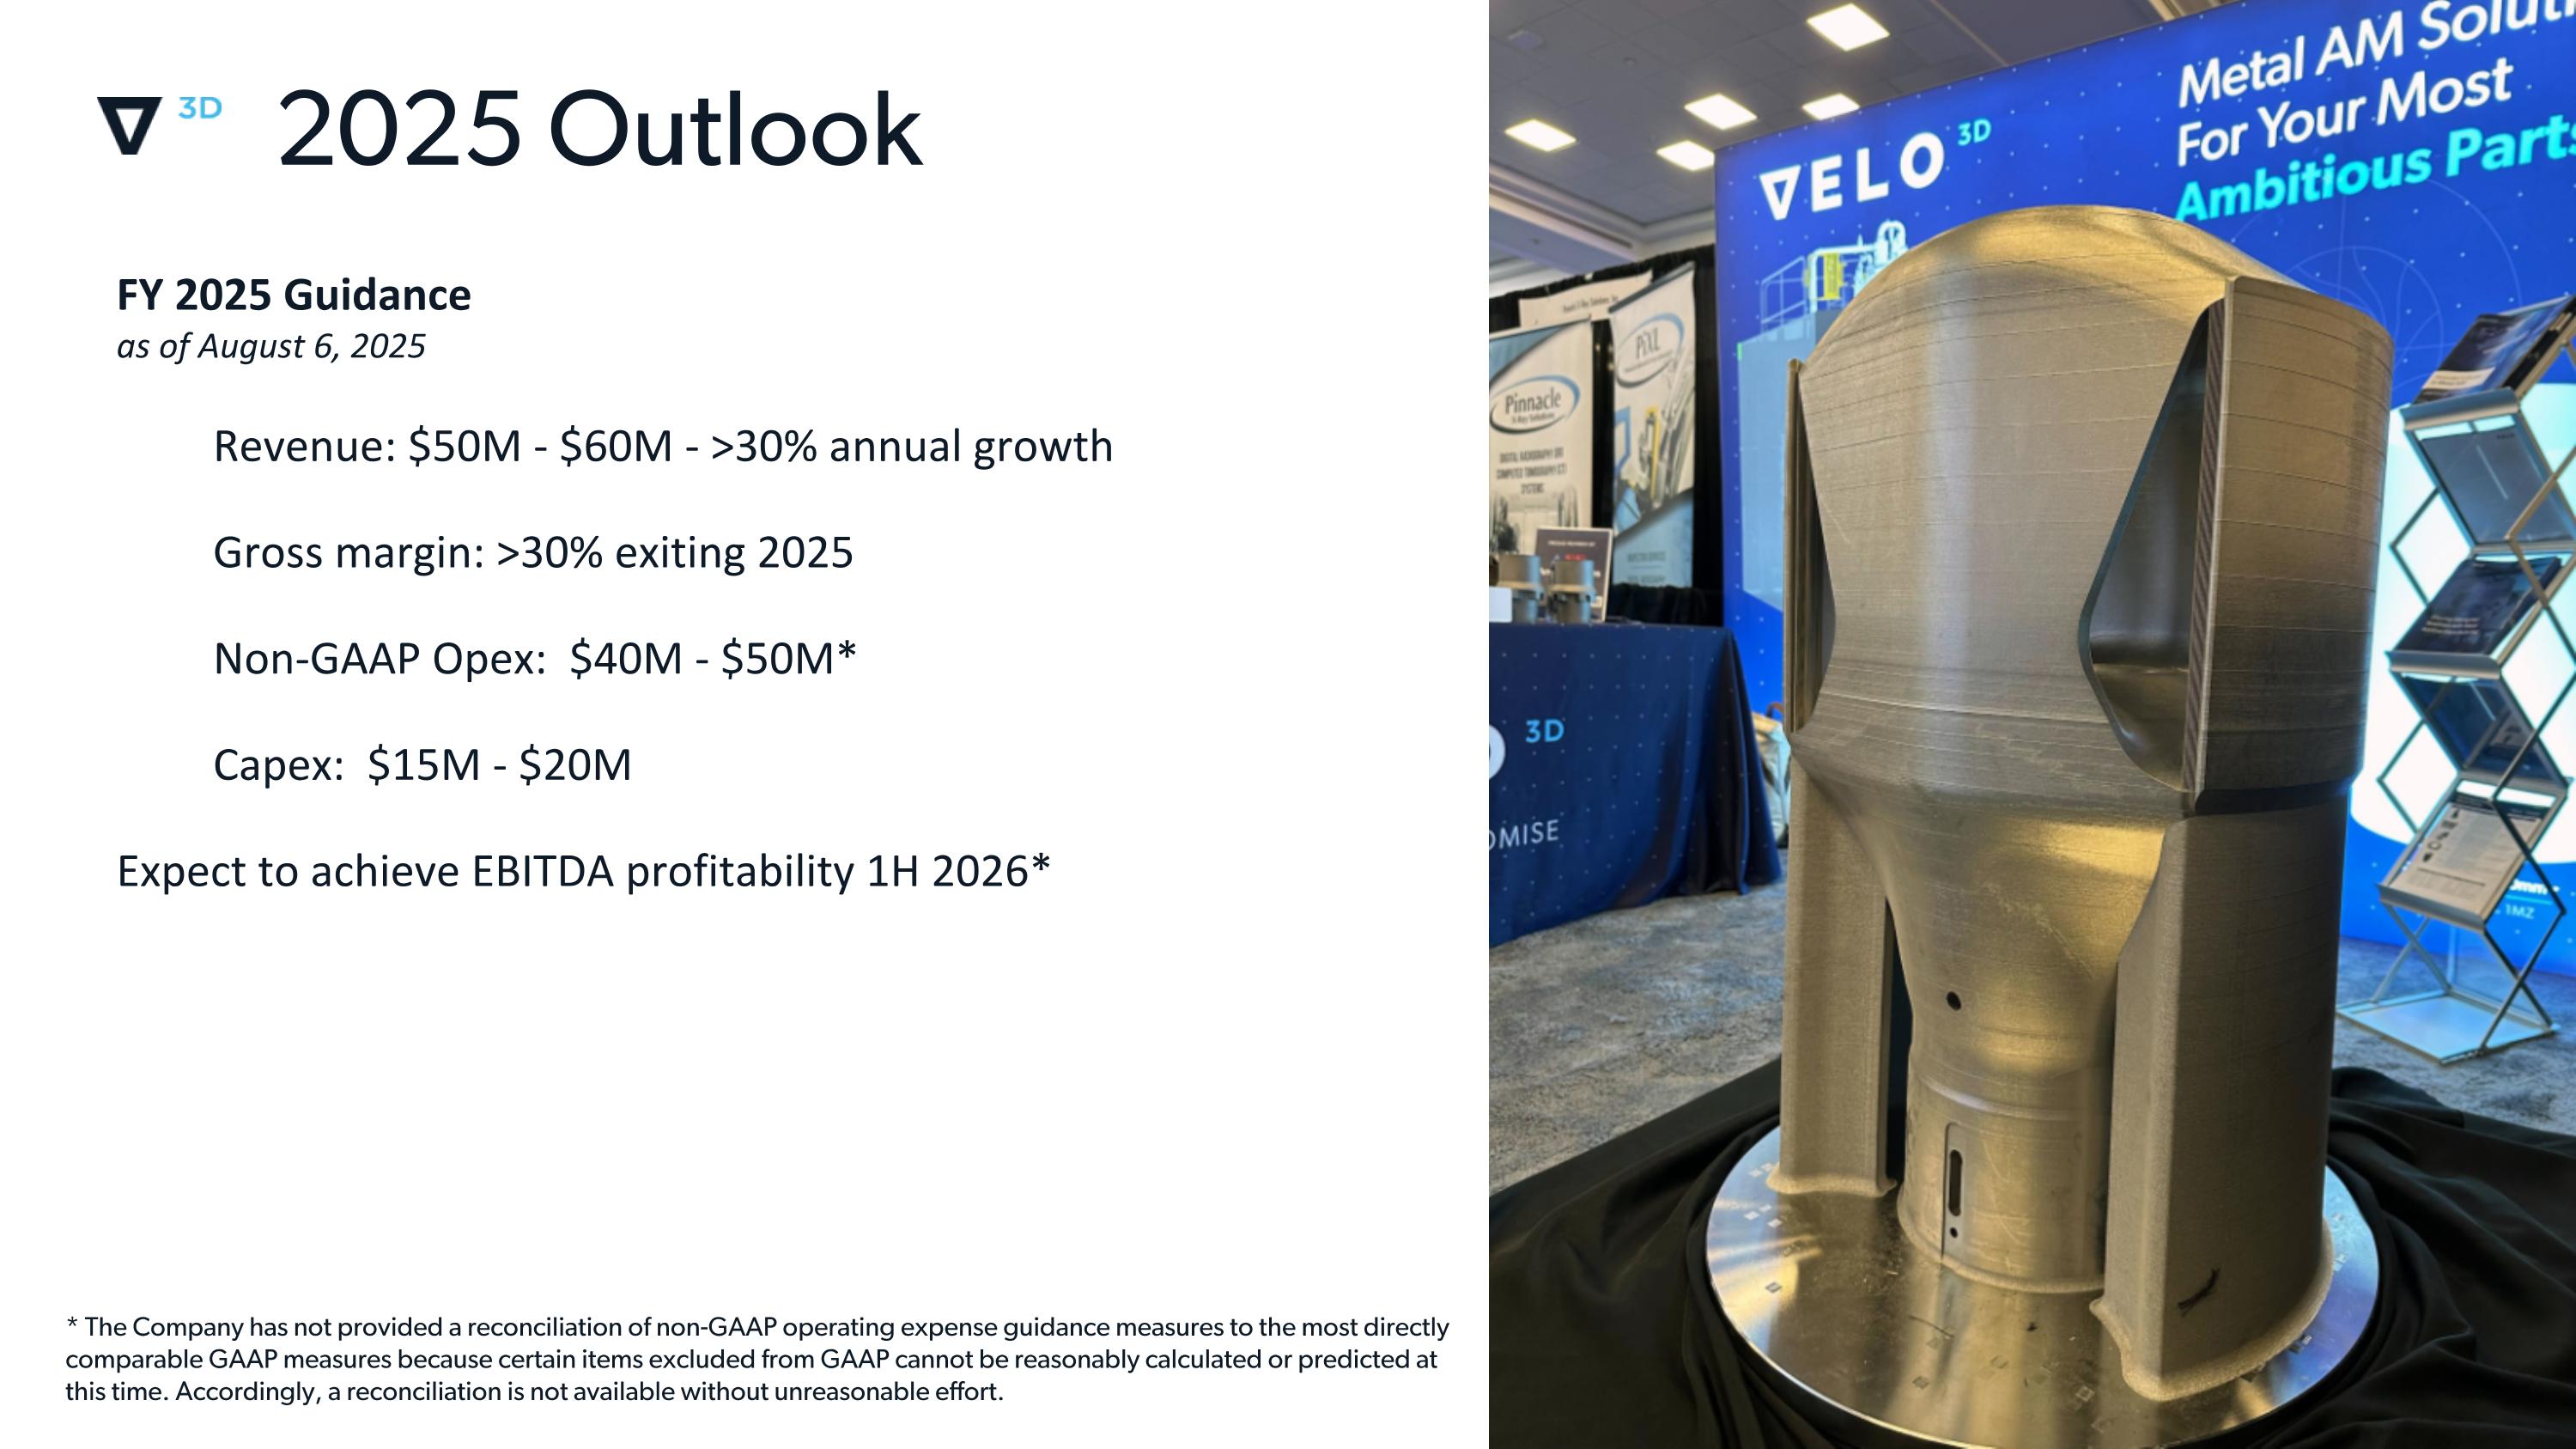
2023 Outlook * Q423 / FY 2023 gross margin ranges excludes impact from non-recurring charges 2025 Outlook FY 2025 Guidance as of August 6, 2025 Revenue: $50M - $60M - >30% annual growth Gross margin: >30% exiting 2025 Non-GAAP Opex: $40M - $50M* Capex: $15M - $20M Expect to achieve EBITDA profitability 1H 2026* * The Company has not provided a reconciliation of non-GAAP operating expense guidance measures to the most directly comparable GAAP measures because certain items excluded from GAAP cannot be reasonably calculated or predicted at this time. Accordingly, a reconciliation is not available without unreasonable effort.

Thank You!
Disclaimer Non-GAAP Financial Information The Company uses non-GAAP financial measures, such as Non-GAAP / Adjusted operating expenses, EBITDA, Adjusted EBITDA, Adjusted EBITDA excluding merger related transactional costs, loss on convertible note modification, and Non-GAAP net (loss), to help it make strategic decisions, establish budgets and operational goals for managing its business, analyze its financial results and evaluate its performance. The Company also believes that the presentation of these non-GAAP financial measures in this presentation provides an additional tool for investors to use in comparing the Company’s core business and results of operations over multiple periods. However, the non-GAAP financial measures presented in this presentation may not be comparable to similarly titled measures reported by other companies due to differences in the way that these measures are calculated. The non-GAAP financial measures presented in this presentation should not be considered as the sole measure of the Company’s performance and should not be considered in isolation from, or as a substitute for, comparable financial measures calculated in accordance with generally accepted accounting principles accepted in the United States (“GAAP”). For reconciliations of these non-GAAP financial measures to the Company’s GAAP financial measures, see Appendix to this presentation. You should review these reconciliations and not rely on any single financial measure to evaluate the Company business. Industry and Market Data In this presentation, the Company relies on and refers to publicly available information and statistics regarding the market in which the Company competes and other industry data. The Company obtained this information and statistics from third-party sources, including reports by market research firms and company filings. While the Company believes such third-party information is reliable, there can be no assurance as to the accuracy or completeness of the indicated information. The Company has not independently verified the information provided by third-party sources. Trademarks This presentation may contain trademarks, service marks, trade names and copyrights of other companies, which are the property of the respective owners. Solely for convenience, some of the trademarks, service marks, trade names and copyrights referred to in this presentation may be listed without the TM, SM, © or ® symbols, but the Company will assert, to the fullest extent under applicable law, the rights of the applicable owners, if any, to these trademarks, service marks, trade names and copyrights.
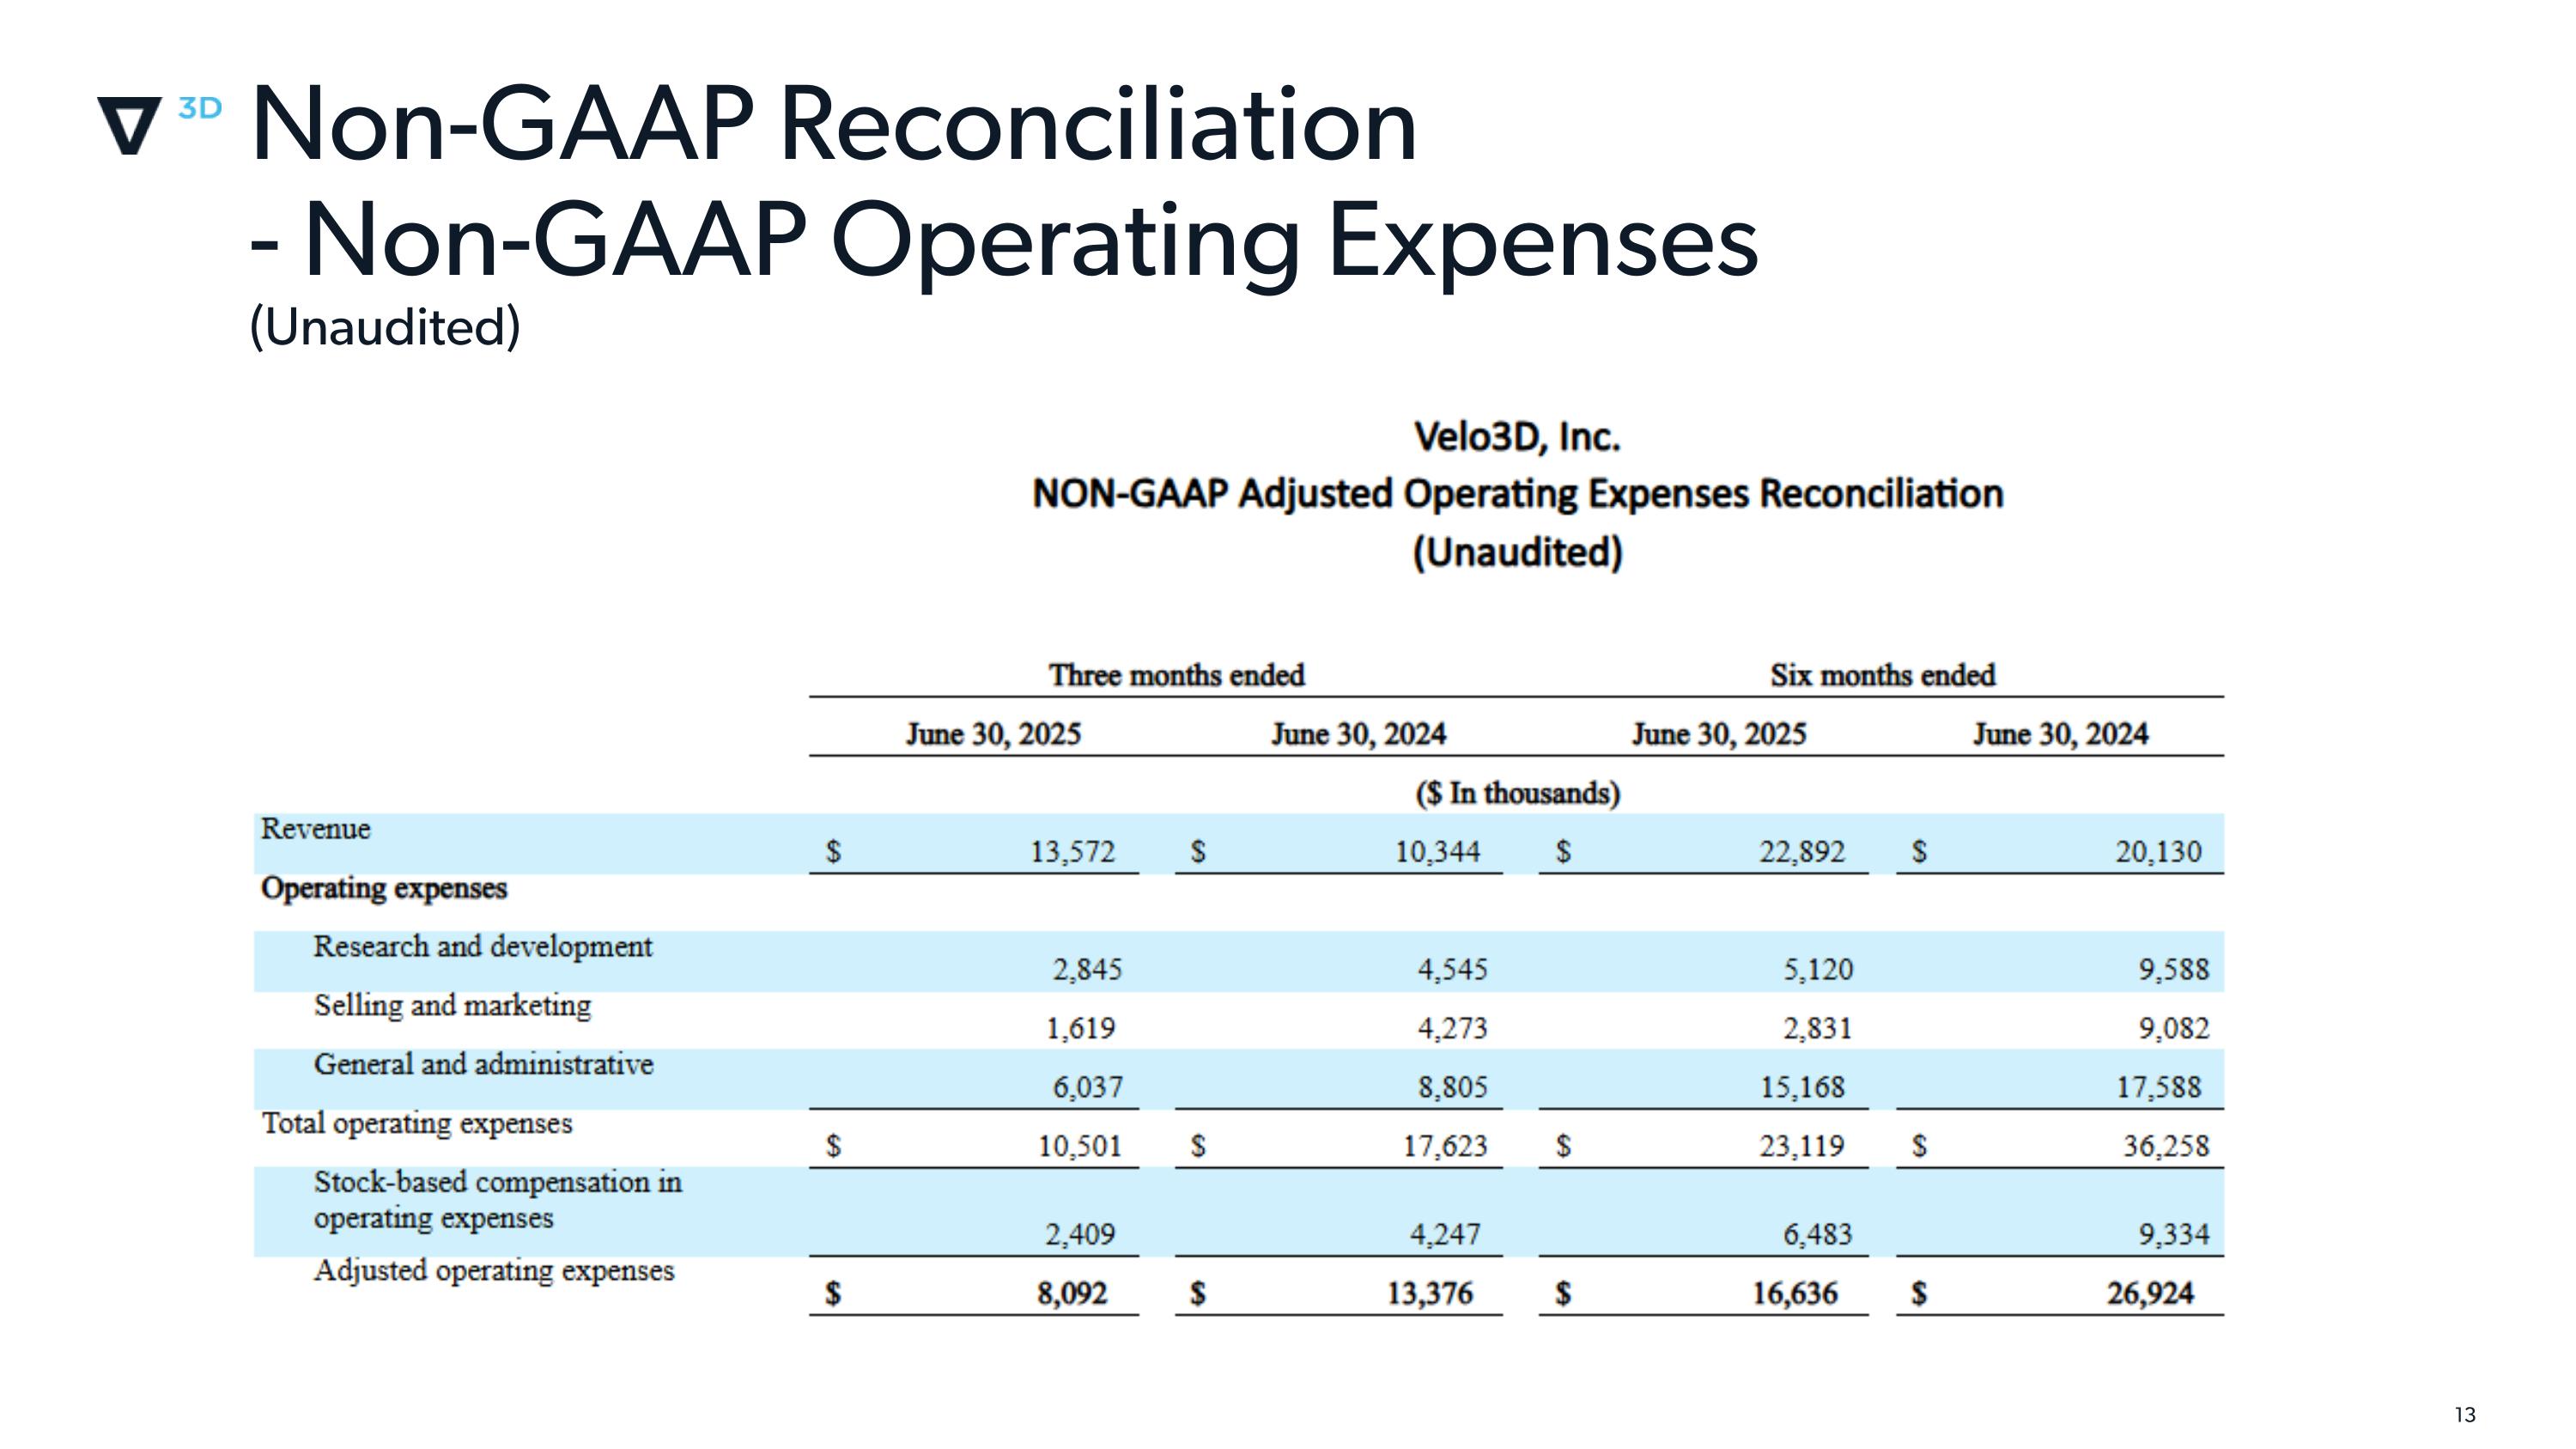
Non-GAAP Reconciliation - Non-GAAP Operating Expenses (Unaudited)
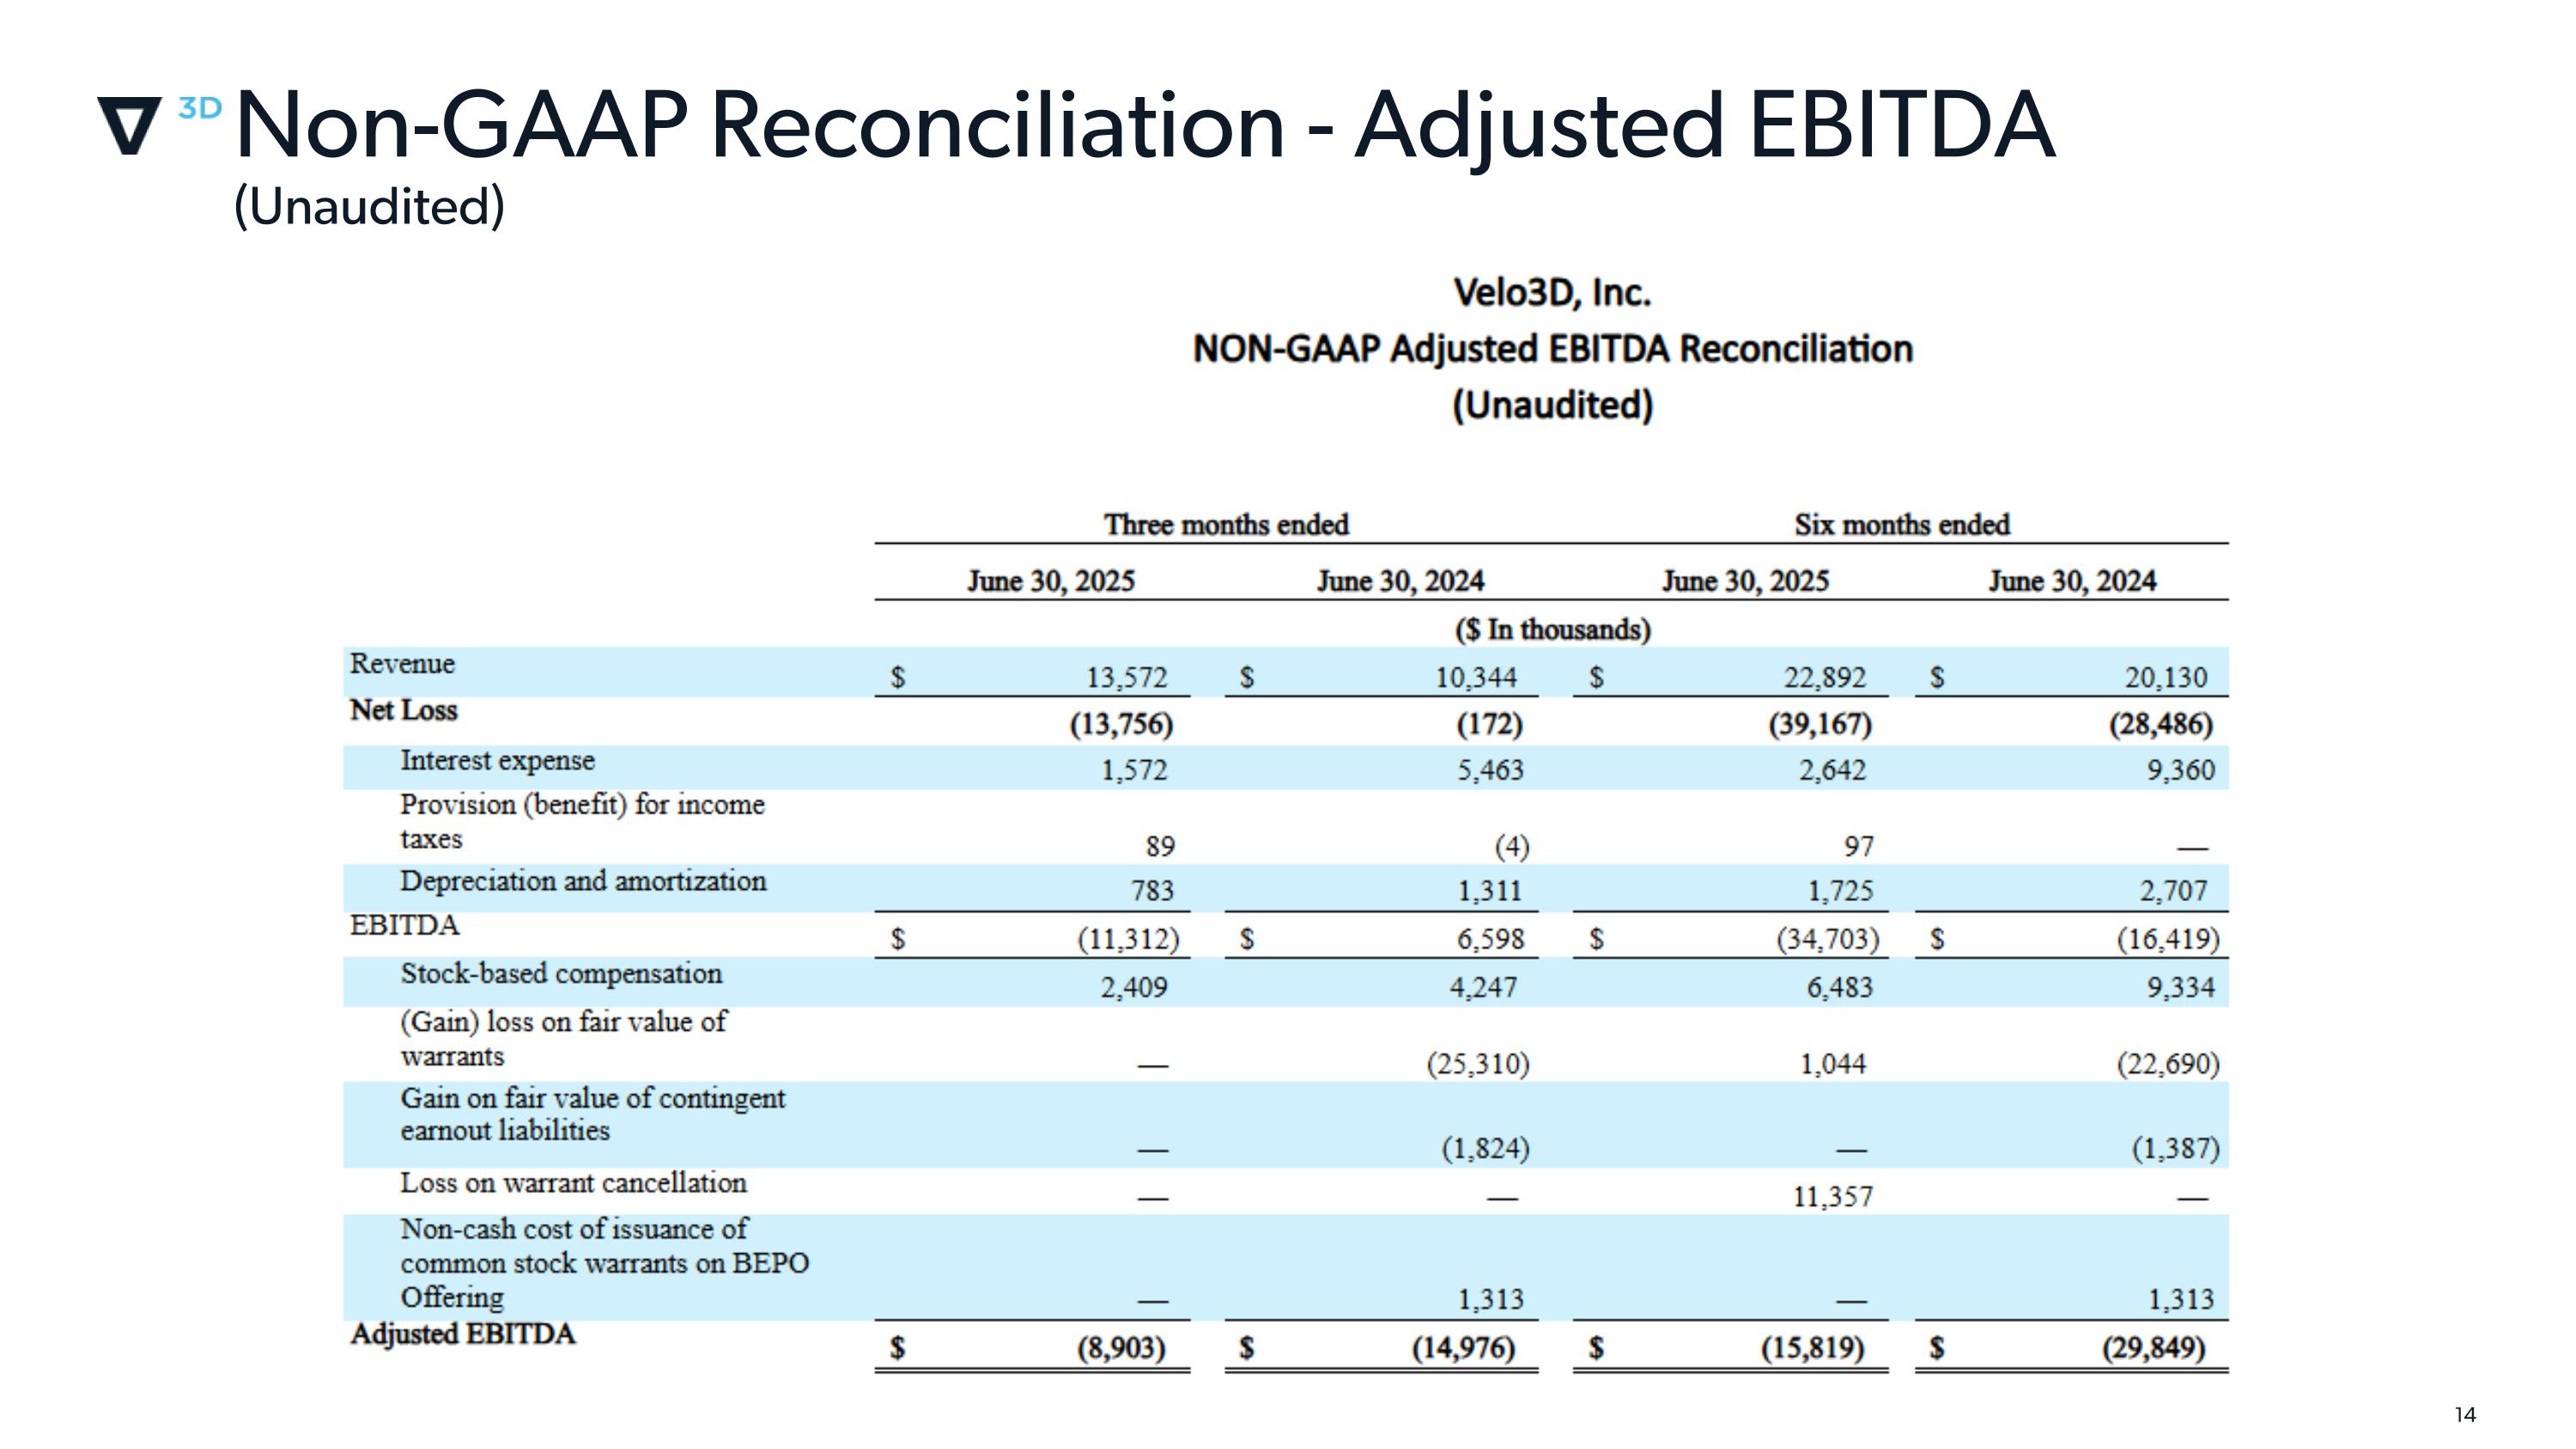
Non-GAAP Reconciliation - Adjusted EBITDA (Unaudited)
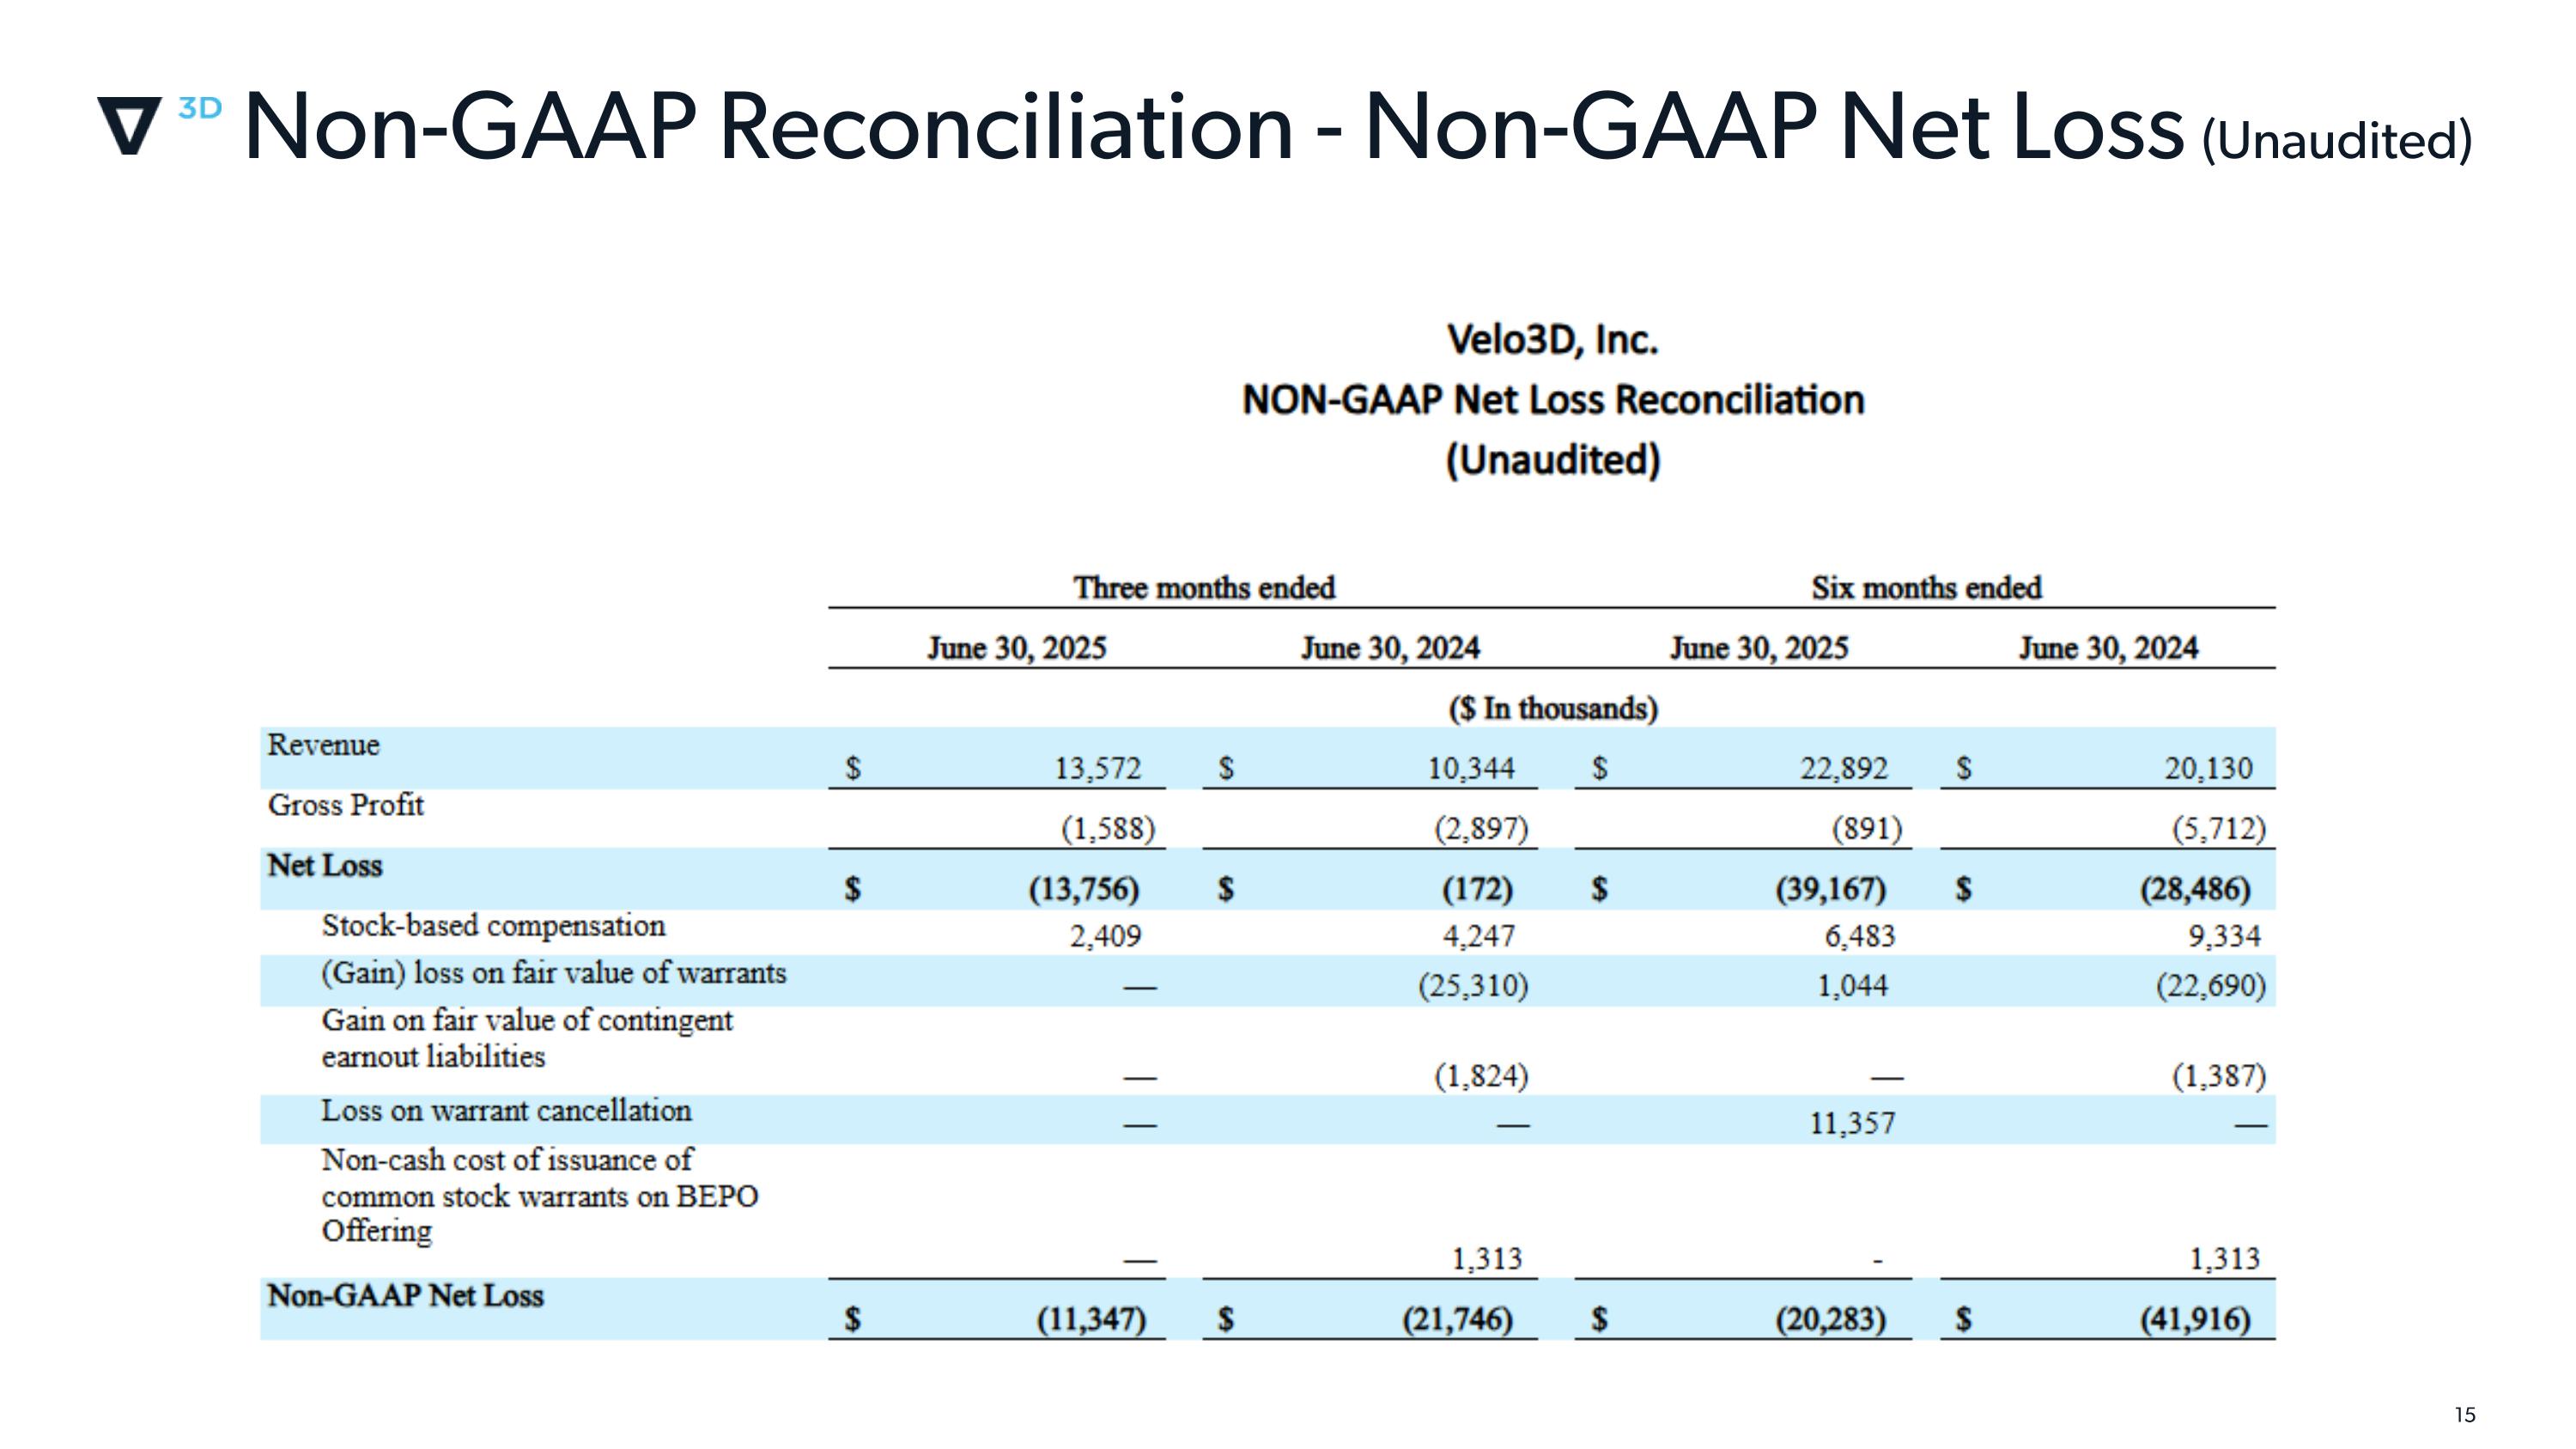
Non-GAAP Reconciliation - Non-GAAP Net Loss (Unaudited)