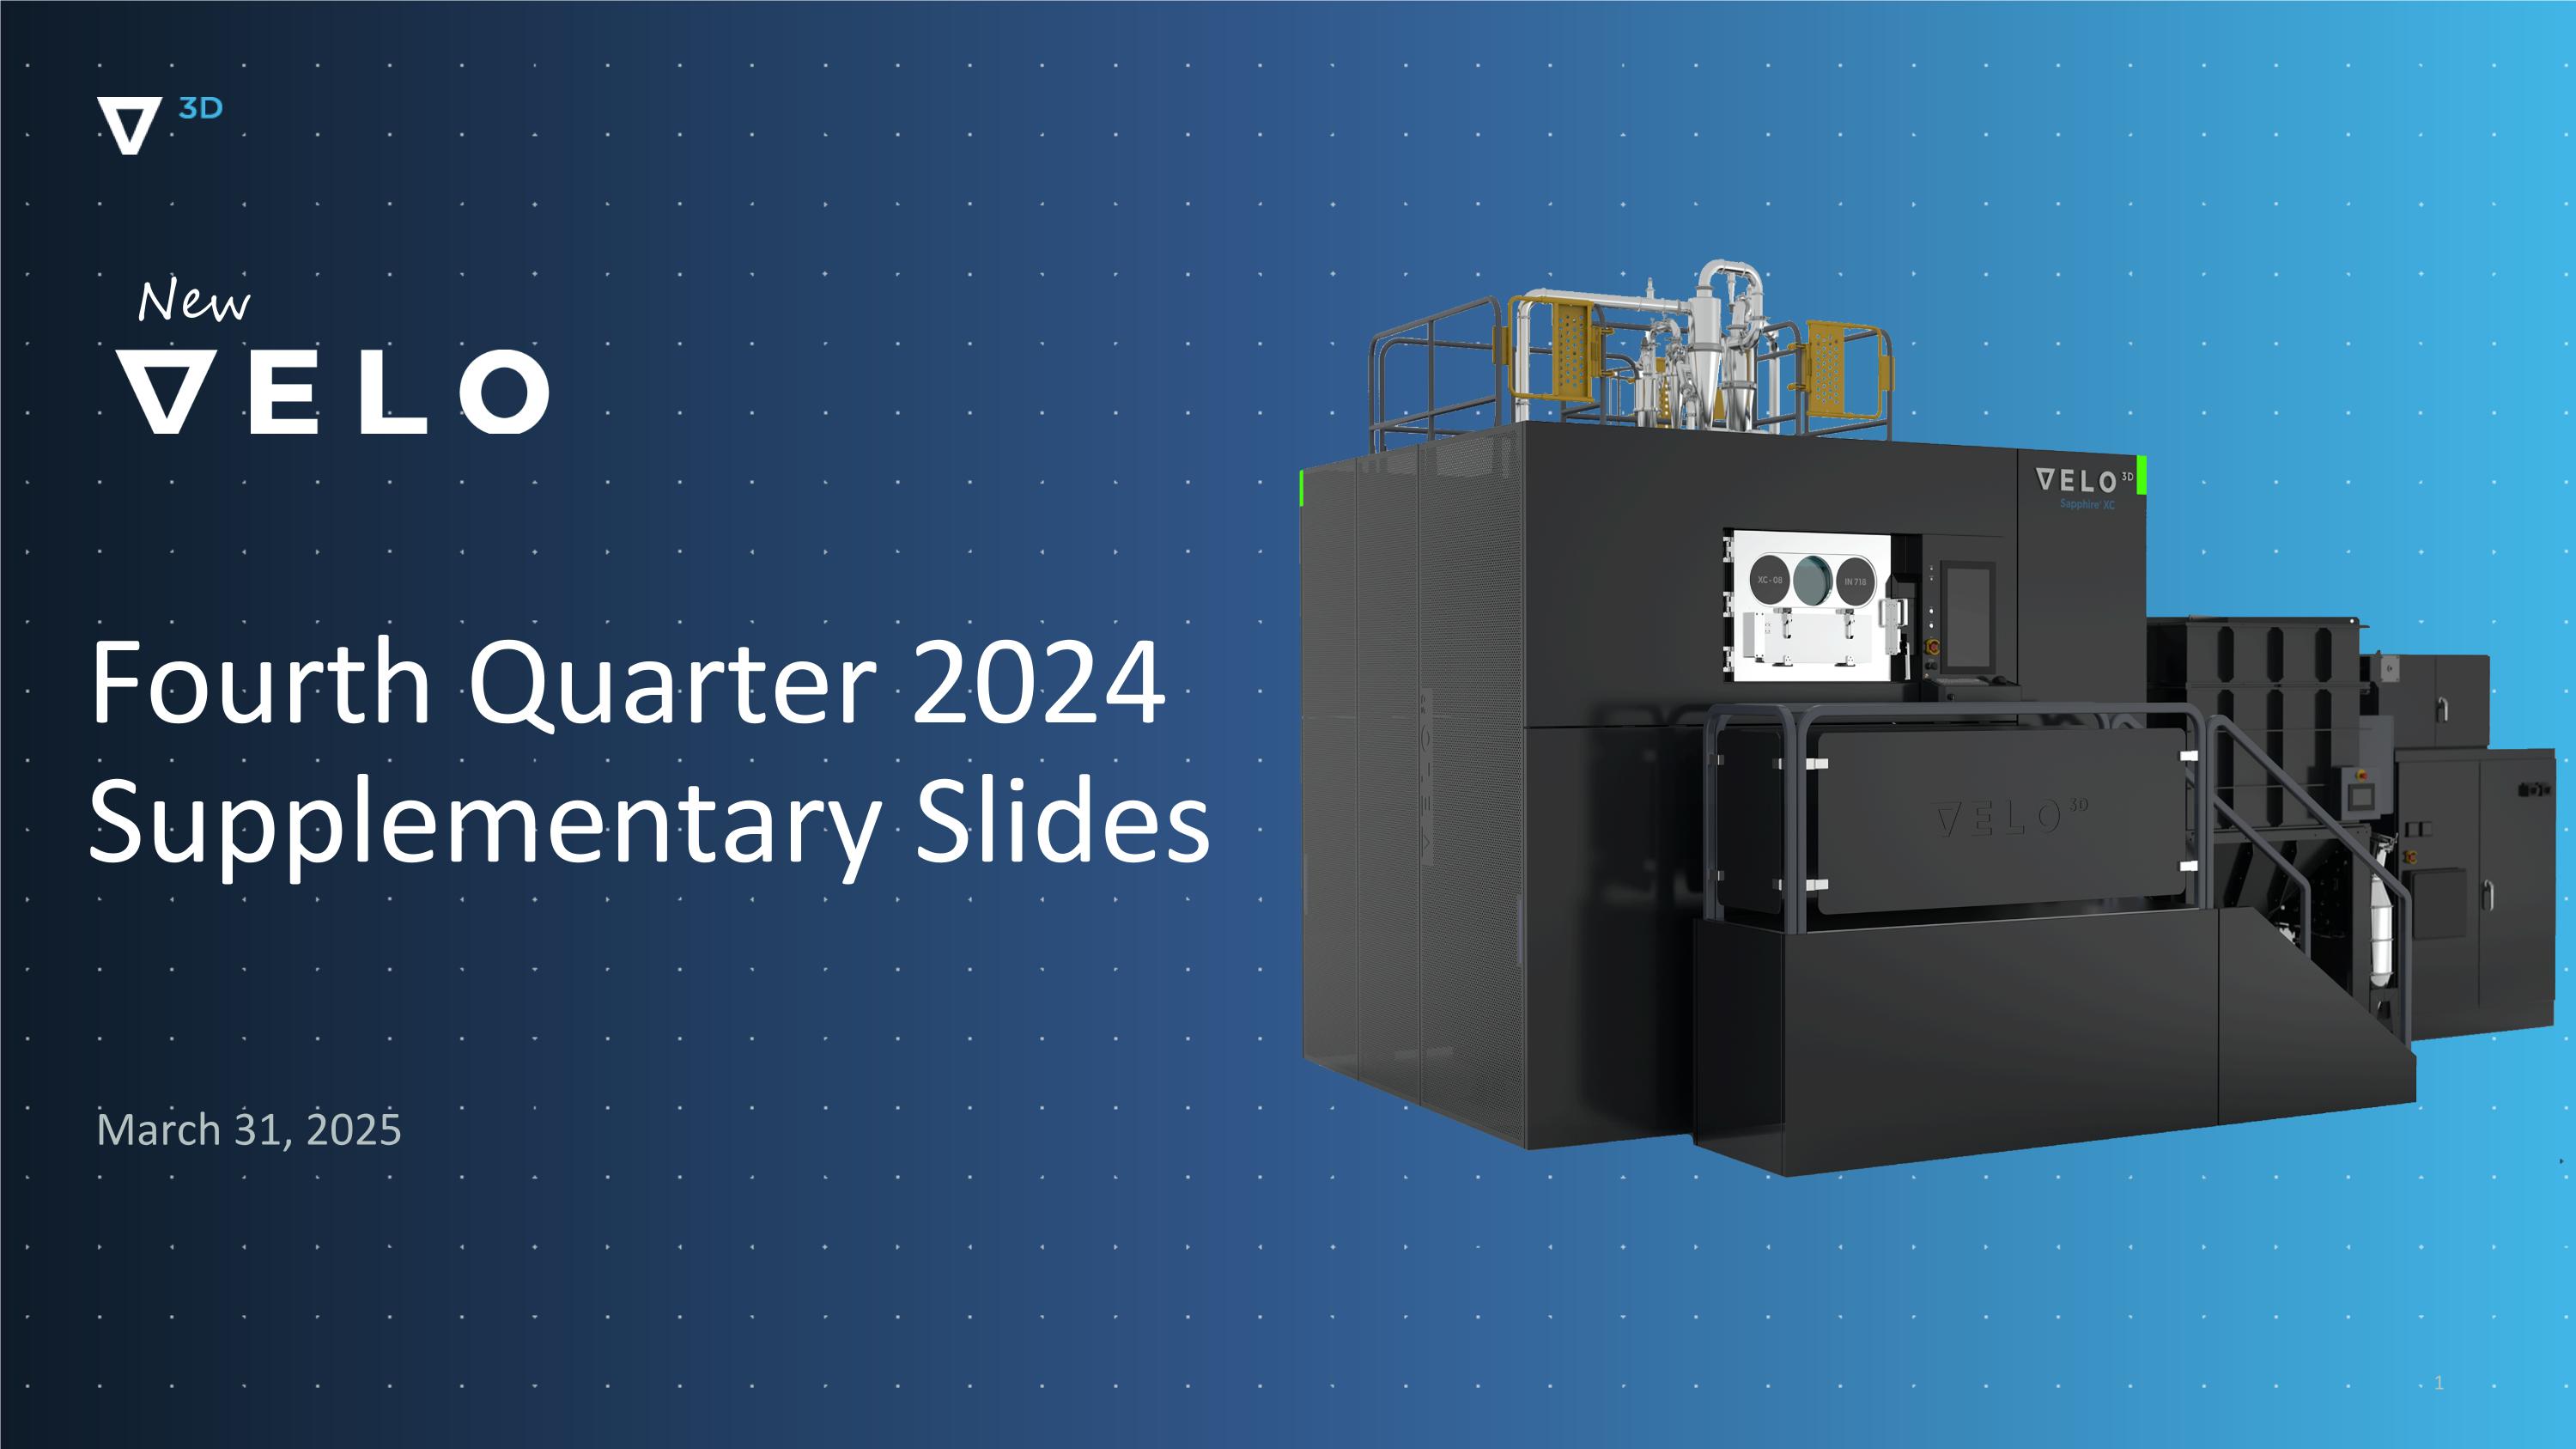

Fourth Quarter 2024 Supplementary Slides March 31, 2025 New
Confidential & Proprietary | Disclaimer Forward Looking Statement This presentation includes “forward-looking statements” within the meaning of the “safe harbor” provisions of the Private Securities Litigation Reform Act of 1996. The company’s actual results may differ from its expectations, estimates and projections and consequently, you should not rely on these forward-looking statements as predictions of future events. Words such as “expect”, “estimate”, “project”, “budget”, “forecast”, “anticipate”, “intend”, “plan”, “may”, “will”, “could”, “should”, “believes”, “predicts”, “potential”, “continue”, and similar expressions are intended to identify such forward-looking statements. These forward-looking statements include, without limitation, the company’s guidance for fiscal years 2025 and 2026 (including the company’s estimates for revenue and gross margin), the company's expectations regarding its ability to achieve profitability in the first half of 2026, the company’s expectations about future demand, the company's strategic realignment and initiatives, the company’s expectations regarding its liquidity and capital requirements, the company’s expectations regarding its potential cost savings, the company’s expectation about its market strategy and financial and operational position, and the company’s other expectations, hopes, beliefs, intentions or strategies for the future. These forward-looking statements involve significant risks and uncertainties that could cause the actual results to differ materially from the expected results. You should carefully consider the risks and uncertainties described in the “Risk Factors” section of the company’s Annual Report on Form 10-K for the fiscal year ended December 31, 2024 (the “FY 2024 10-K”) and the other documents filed by the company from time to time with the SEC. These filings identify and address other important risks and uncertainties that could cause actual events and results to differ materially from those contained in the forward-looking statements. Most of these factors are outside the company’s control and are difficult to predict. Factors that may cause such differences include, but are not limited to: (1) the inability of the company to execute its business plan, which may be affected by, among other things, competition, the ability of the company to grow and manage growth profitably, maintain relationships with customers and suppliers and retain its key employees; (2) the company’s ability to continue as a going concern; (3) the company’s ability to service and comply with its indebtedness; (4) the company’s ability to raise additional capital in the near-term; (5) the possibility that the company may be adversely affected by other economic, business, and/or competitive factors; (6) changes in the applicable laws and regulations, and (7) other risks and uncertainties indicated from time to time described in the FY 2024 10-K, including those under “Risk Factors” therein, and in the company’s other filings with the SEC. The company cautions that the foregoing list of factors is not exclusive and not to place undue reliance upon any forward-looking statements, including projections, which speak only as of the date made. The company does not undertake or accept any obligation to release publicly any updates or revisions to any forward-looking statements to reflect any change in its expectations or any change in events, conditions or circumstances on which any such statement is based. * Additional information on the use of Non-GAAP financial information, industry and market data, and trademarks is included in the appendix of this presentation.
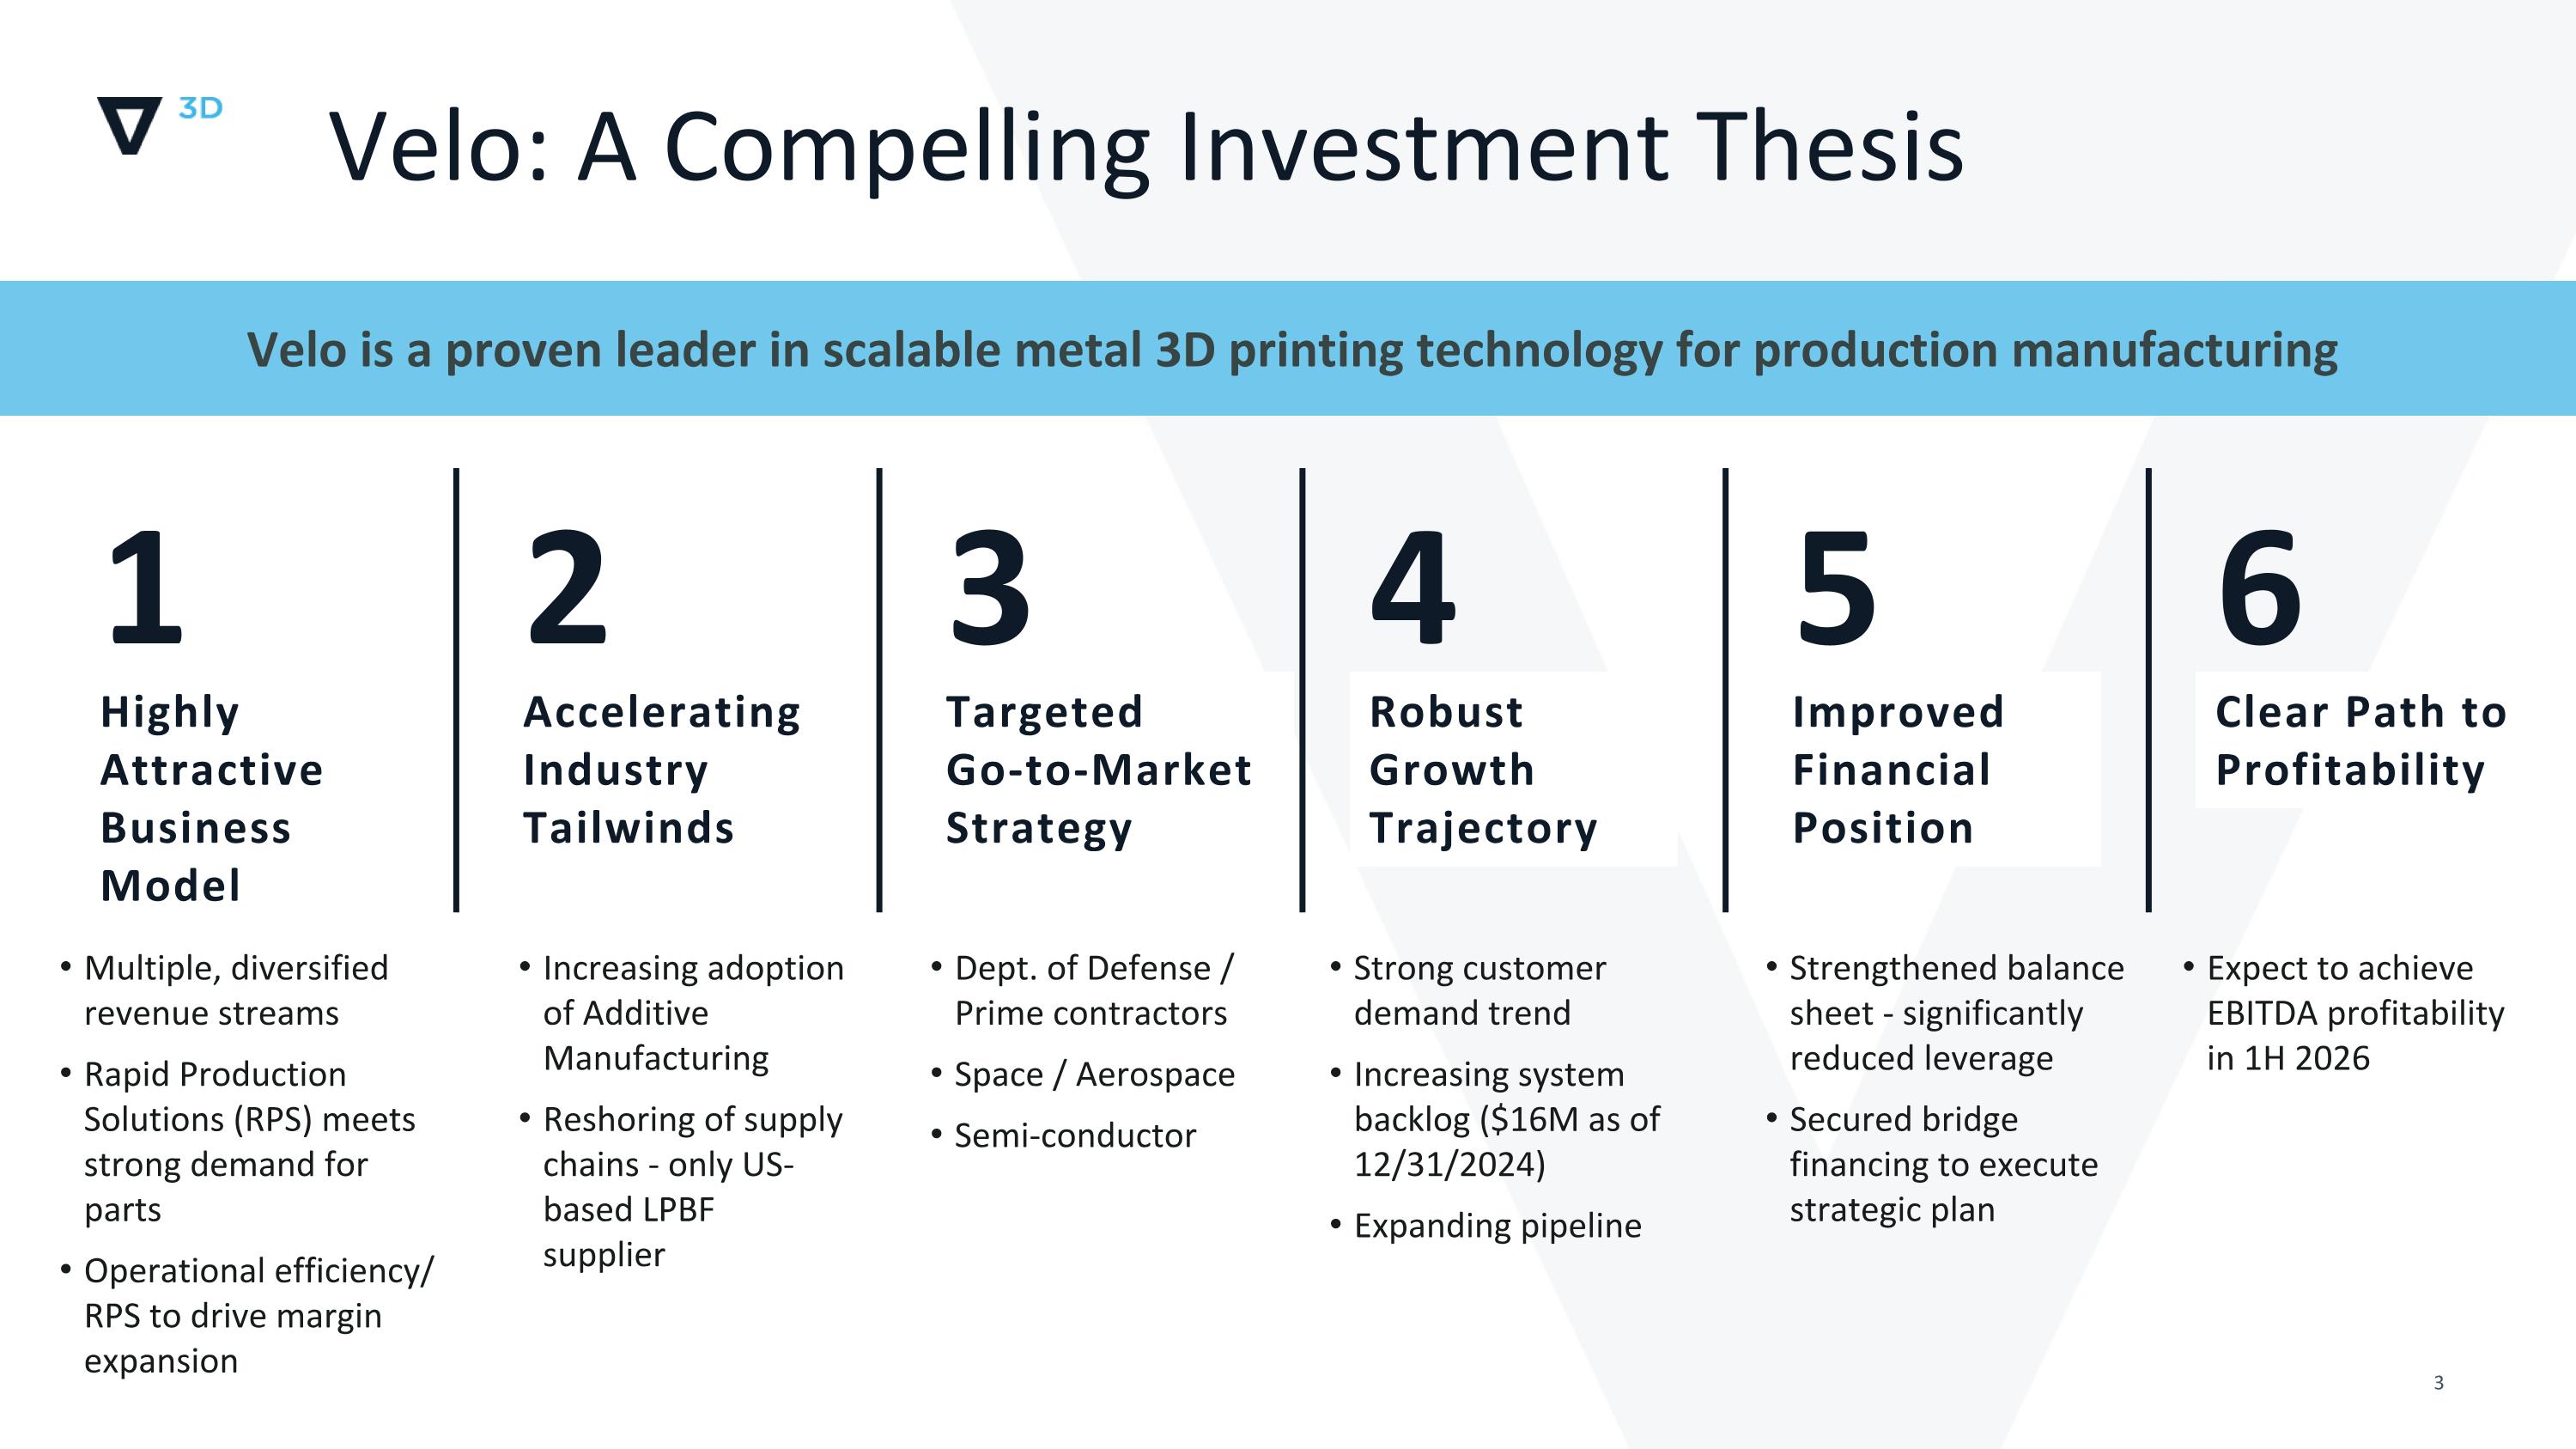
Velo: A Compelling Investment Thesis Highly Attractive Business Model 1 2 Accelerating Industry Tailwinds 3 Targeted Go-to-Market Strategy 4 Robust Growth Trajectory 5 Improved Financial Position 6 Clear Path to Profitability Velo is a proven leader in scalable metal 3D printing technology for production manufacturing Multiple, diversified revenue streams Rapid Production Solutions (RPS) meets strong demand for parts Operational efficiency/ RPS to drive margin expansion Increasing adoption of Additive Manufacturing Reshoring of supply chains - only US-based LPBF supplier Dept. of Defense / Prime contractors Space / Aerospace Semi-conductor Strong customer demand trend Increasing system backlog ($16M as of 12/31/2024) Expanding pipeline Strengthened balance sheet - significantly reduced leverage Secured bridge financing to execute strategic plan Expect to achieve EBITDA profitability in 1H 2026
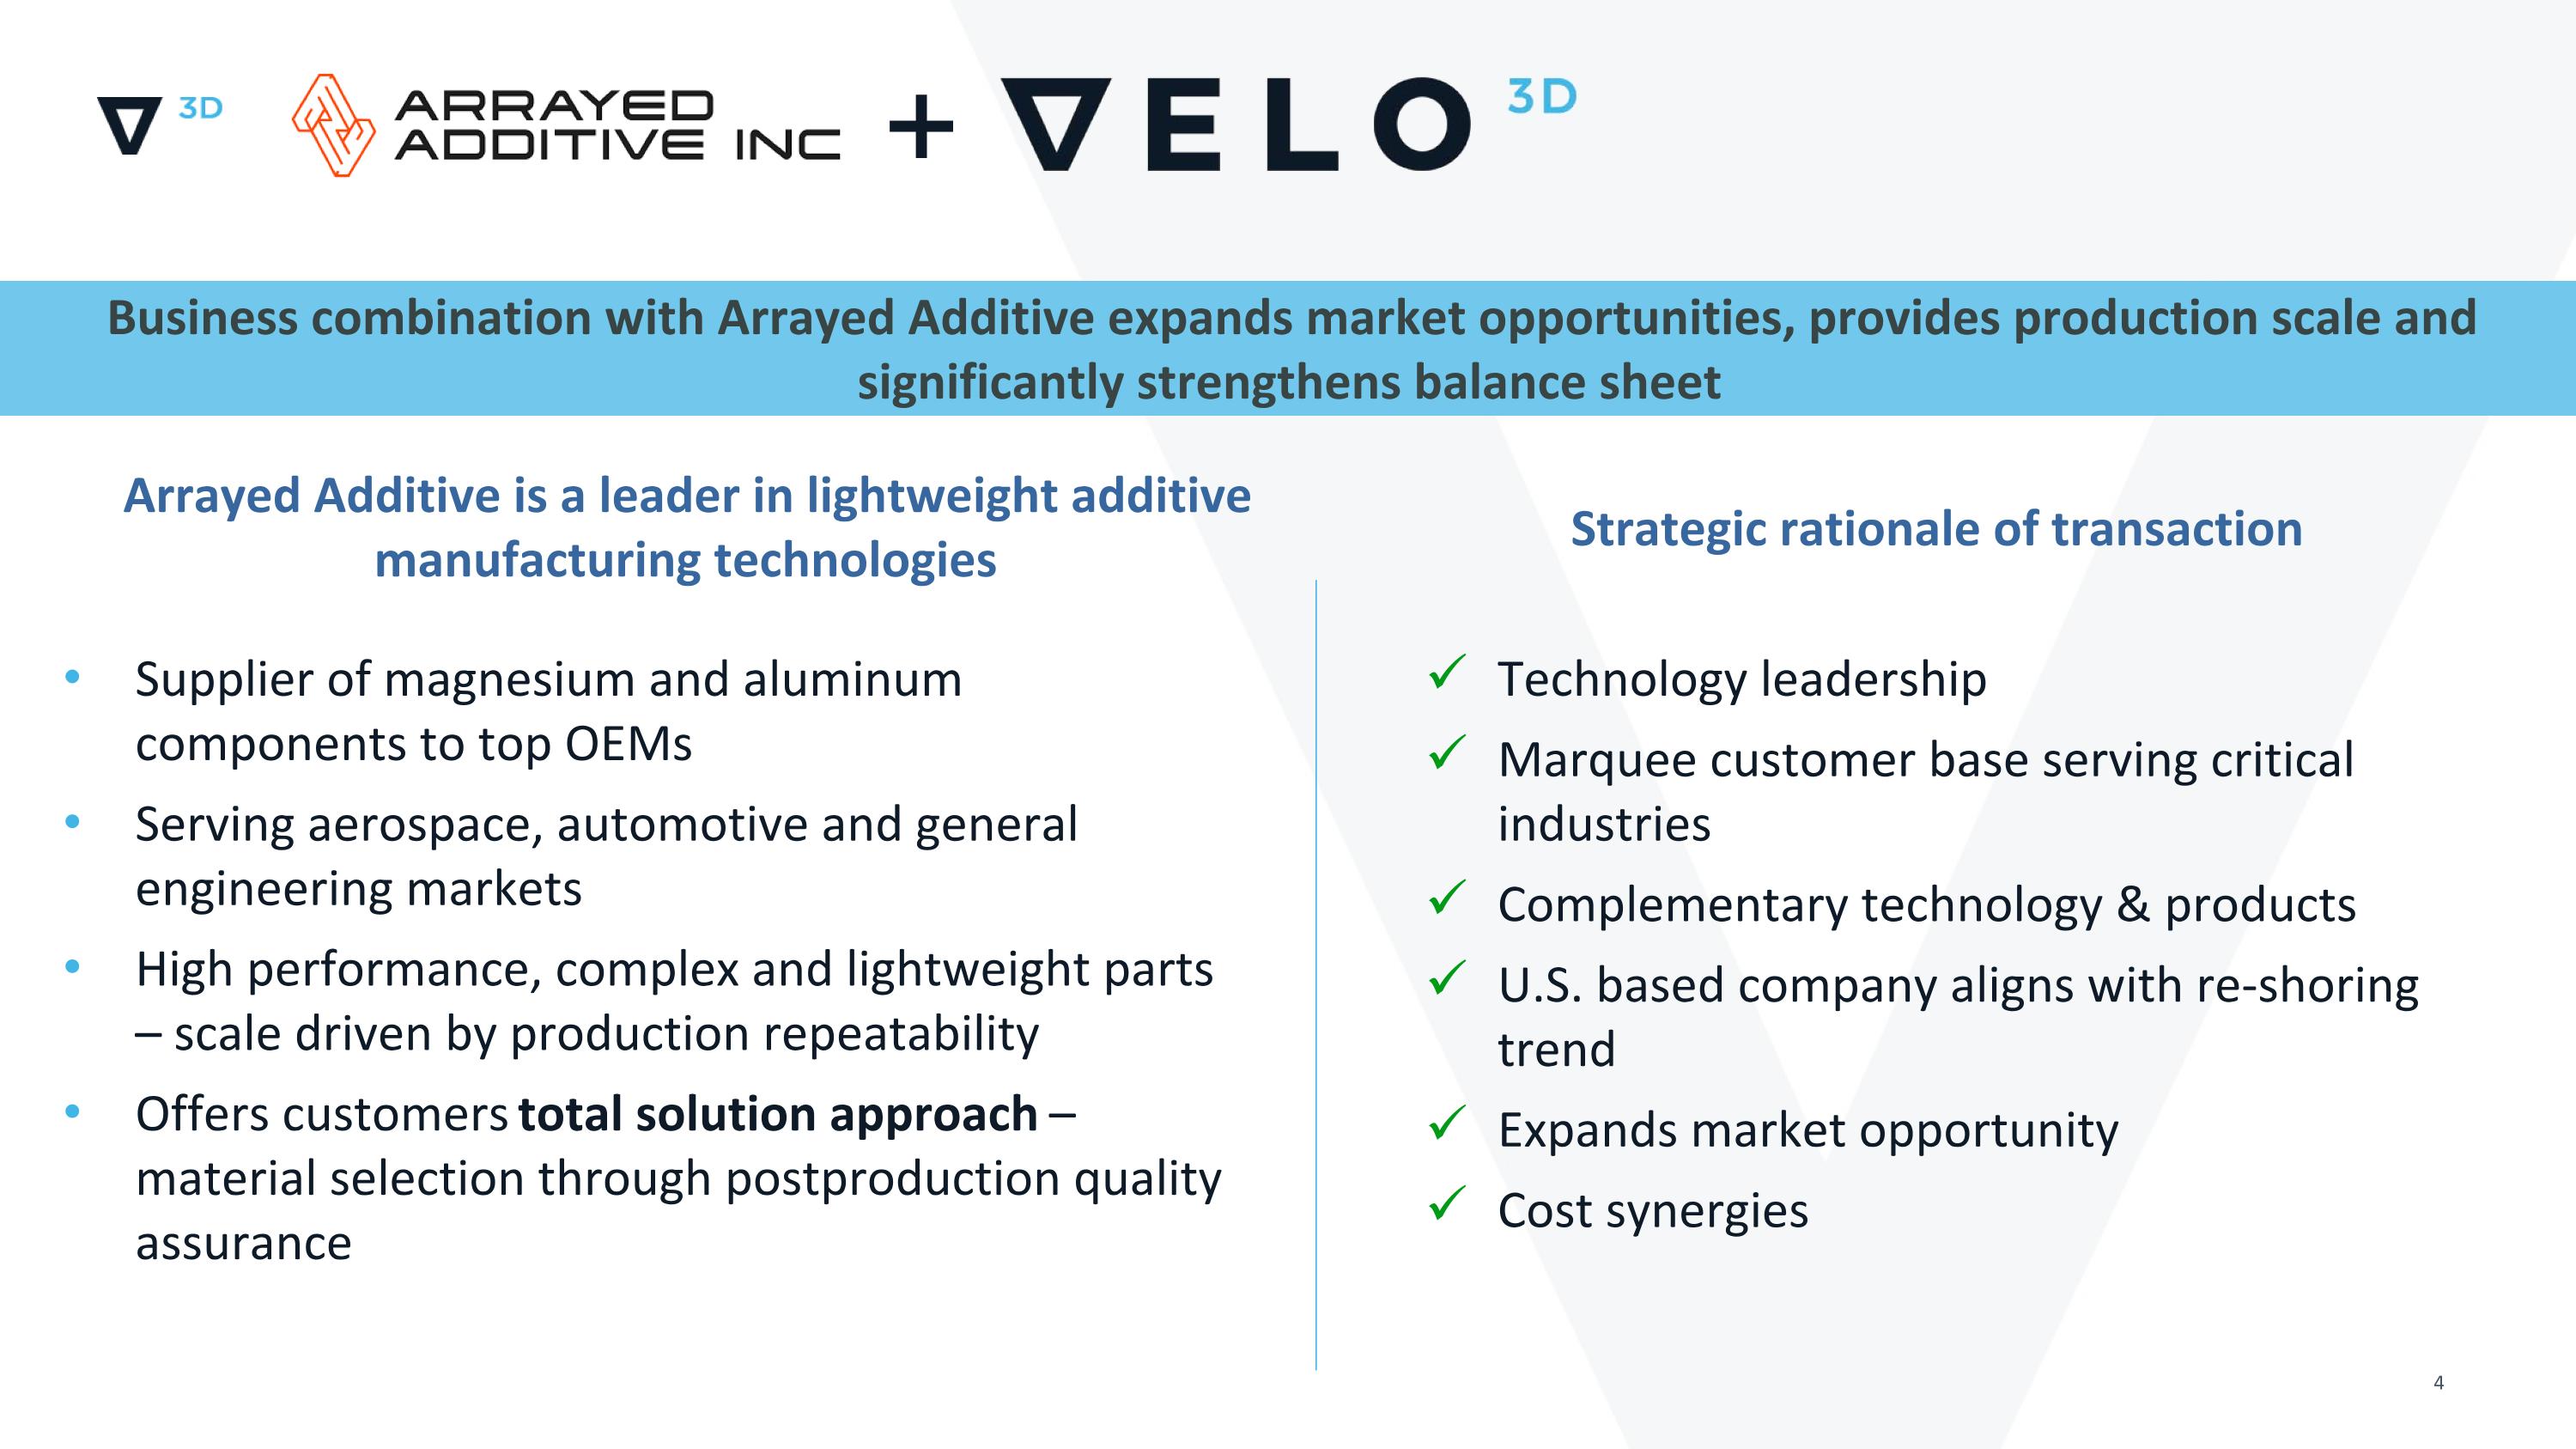
Technology leadership Marquee customer base serving critical industries Complementary technology & products U.S. based company aligns with re-shoring trend Expands market opportunity Cost synergies + Business combination with Arrayed Additive expands market opportunities, provides production scale and significantly strengthens balance sheet Supplier of magnesium and aluminum components to top OEMs Serving aerospace, automotive and general engineering markets High performance, complex and lightweight parts – scale driven by production repeatability Offers customers total solution approach – material selection through postproduction quality assurance Arrayed Additive is a leader in lightweight additive manufacturing technologies Strategic rationale of transaction
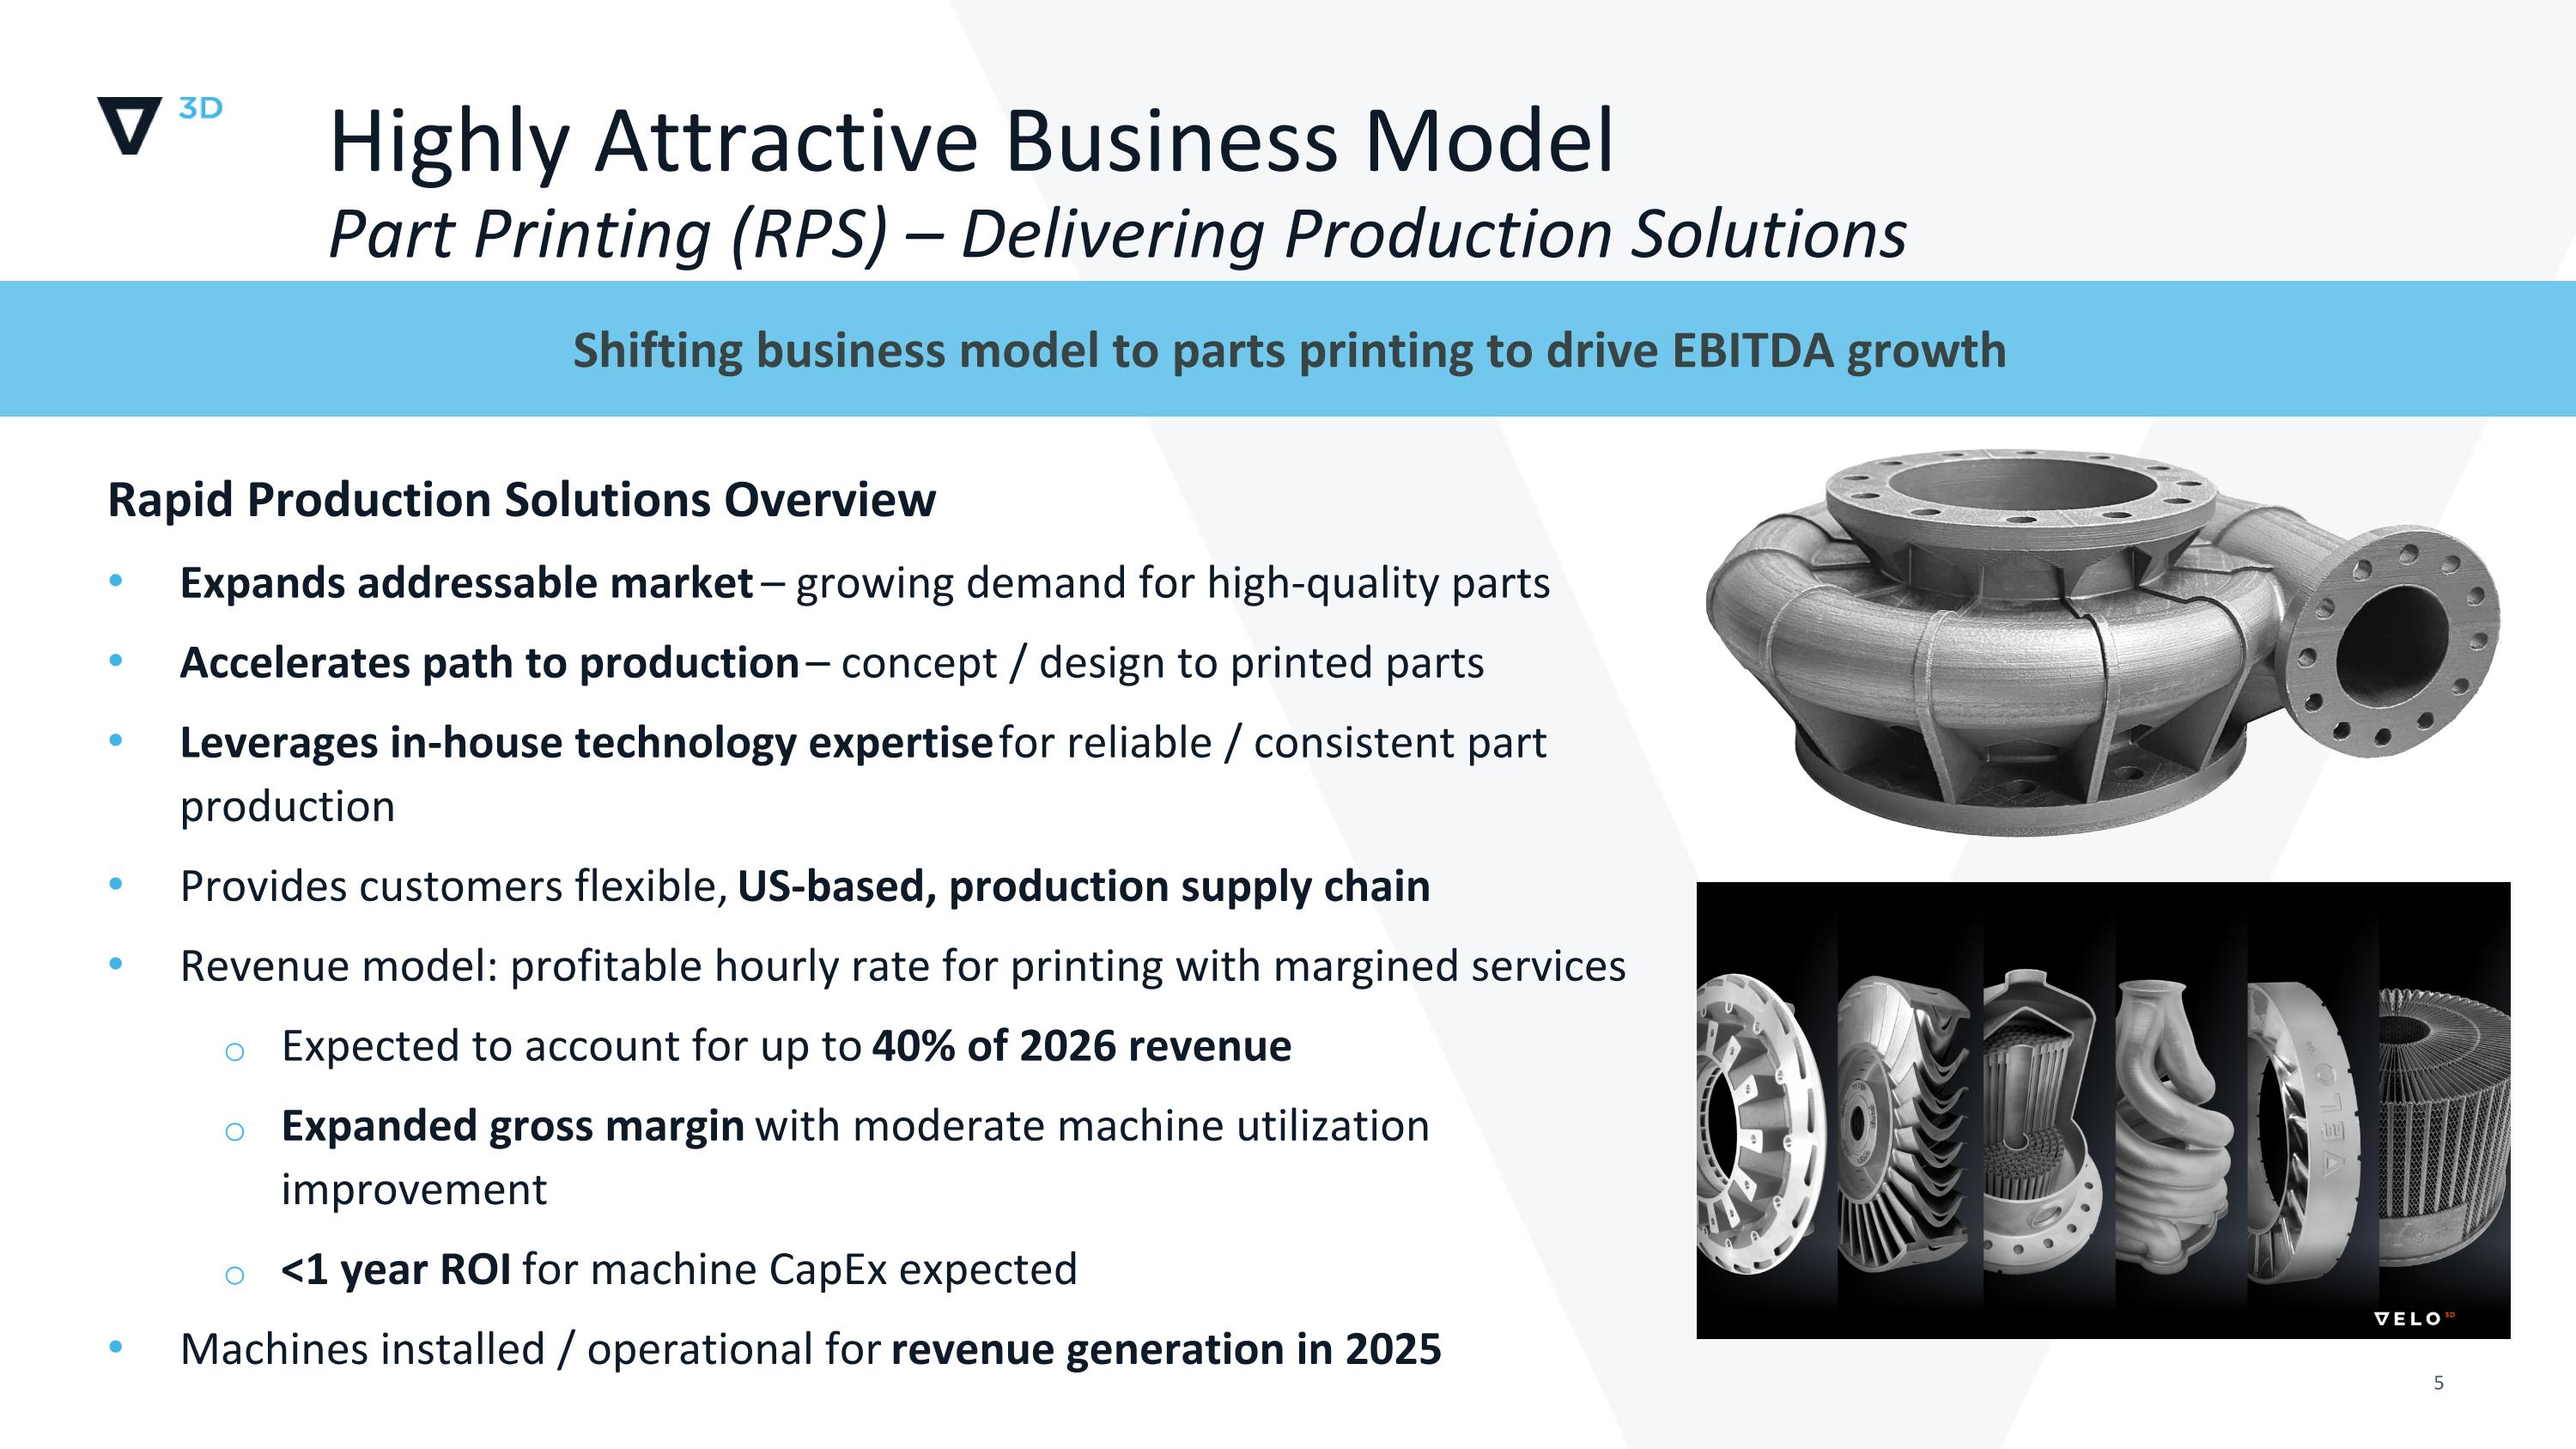
Highly Attractive Business Model Part Printing (RPS) – Delivering Production Solutions Rapid Production Solutions Overview Expands addressable market – growing demand for high-quality parts Accelerates path to production – concept / design to printed parts Leverages in-house technology expertise for reliable / consistent part production Provides customers flexible, US-based, production supply chain Revenue model: profitable hourly rate for printing with margined services Expected to account for up to 40% of 2026 revenue Expanded gross margin with moderate machine utilization improvement <1 year ROI for machine CapEx expected Machines installed / operational for revenue generation in 2025 Shifting business model to parts printing to drive EBITDA growth
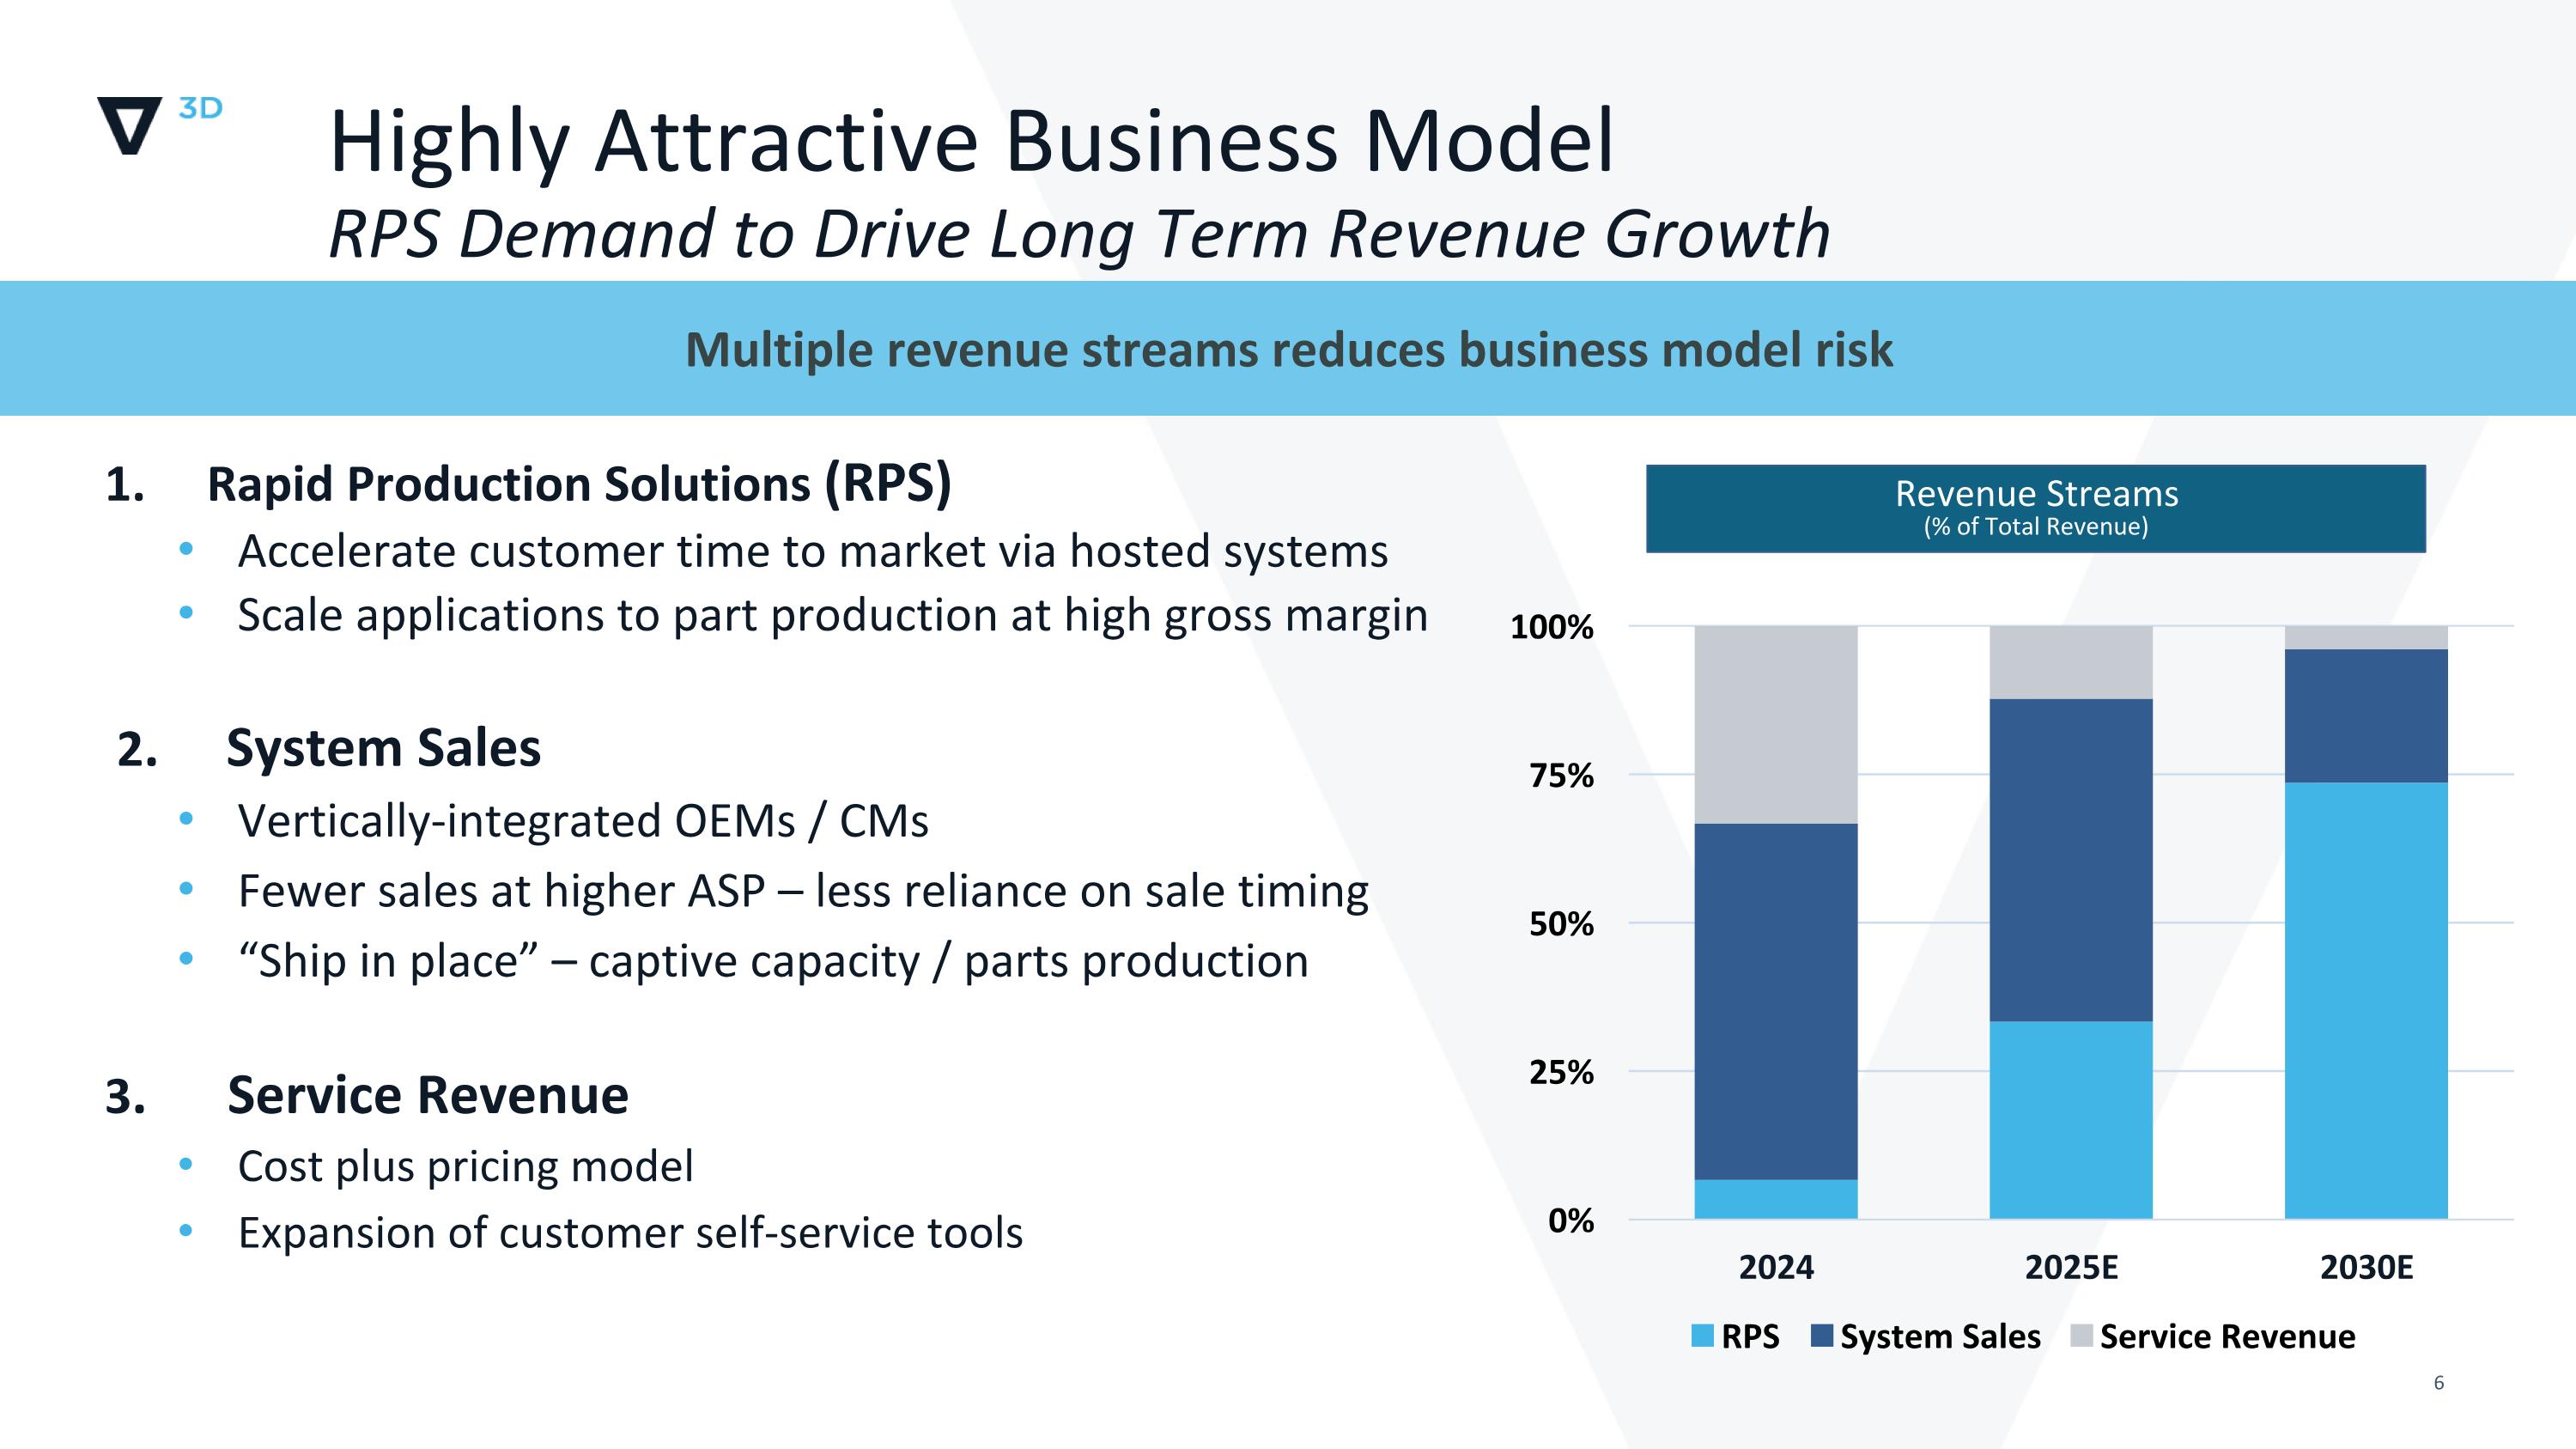
Multiple revenue streams reduces business model risk Highly Attractive Business Model RPS Demand to Drive Long Term Revenue Growth 1. Rapid Production Solutions (RPS) Accelerate customer time to market via hosted systems Scale applications to part production at high gross margin 2. System Sales Vertically-integrated OEMs / CMs Fewer sales at higher ASP – less reliance on sale timing “Ship in place” – captive capacity / parts production 3. Service Revenue Cost plus pricing model Expansion of customer self-service tools Revenue Streams (% of Total Revenue)
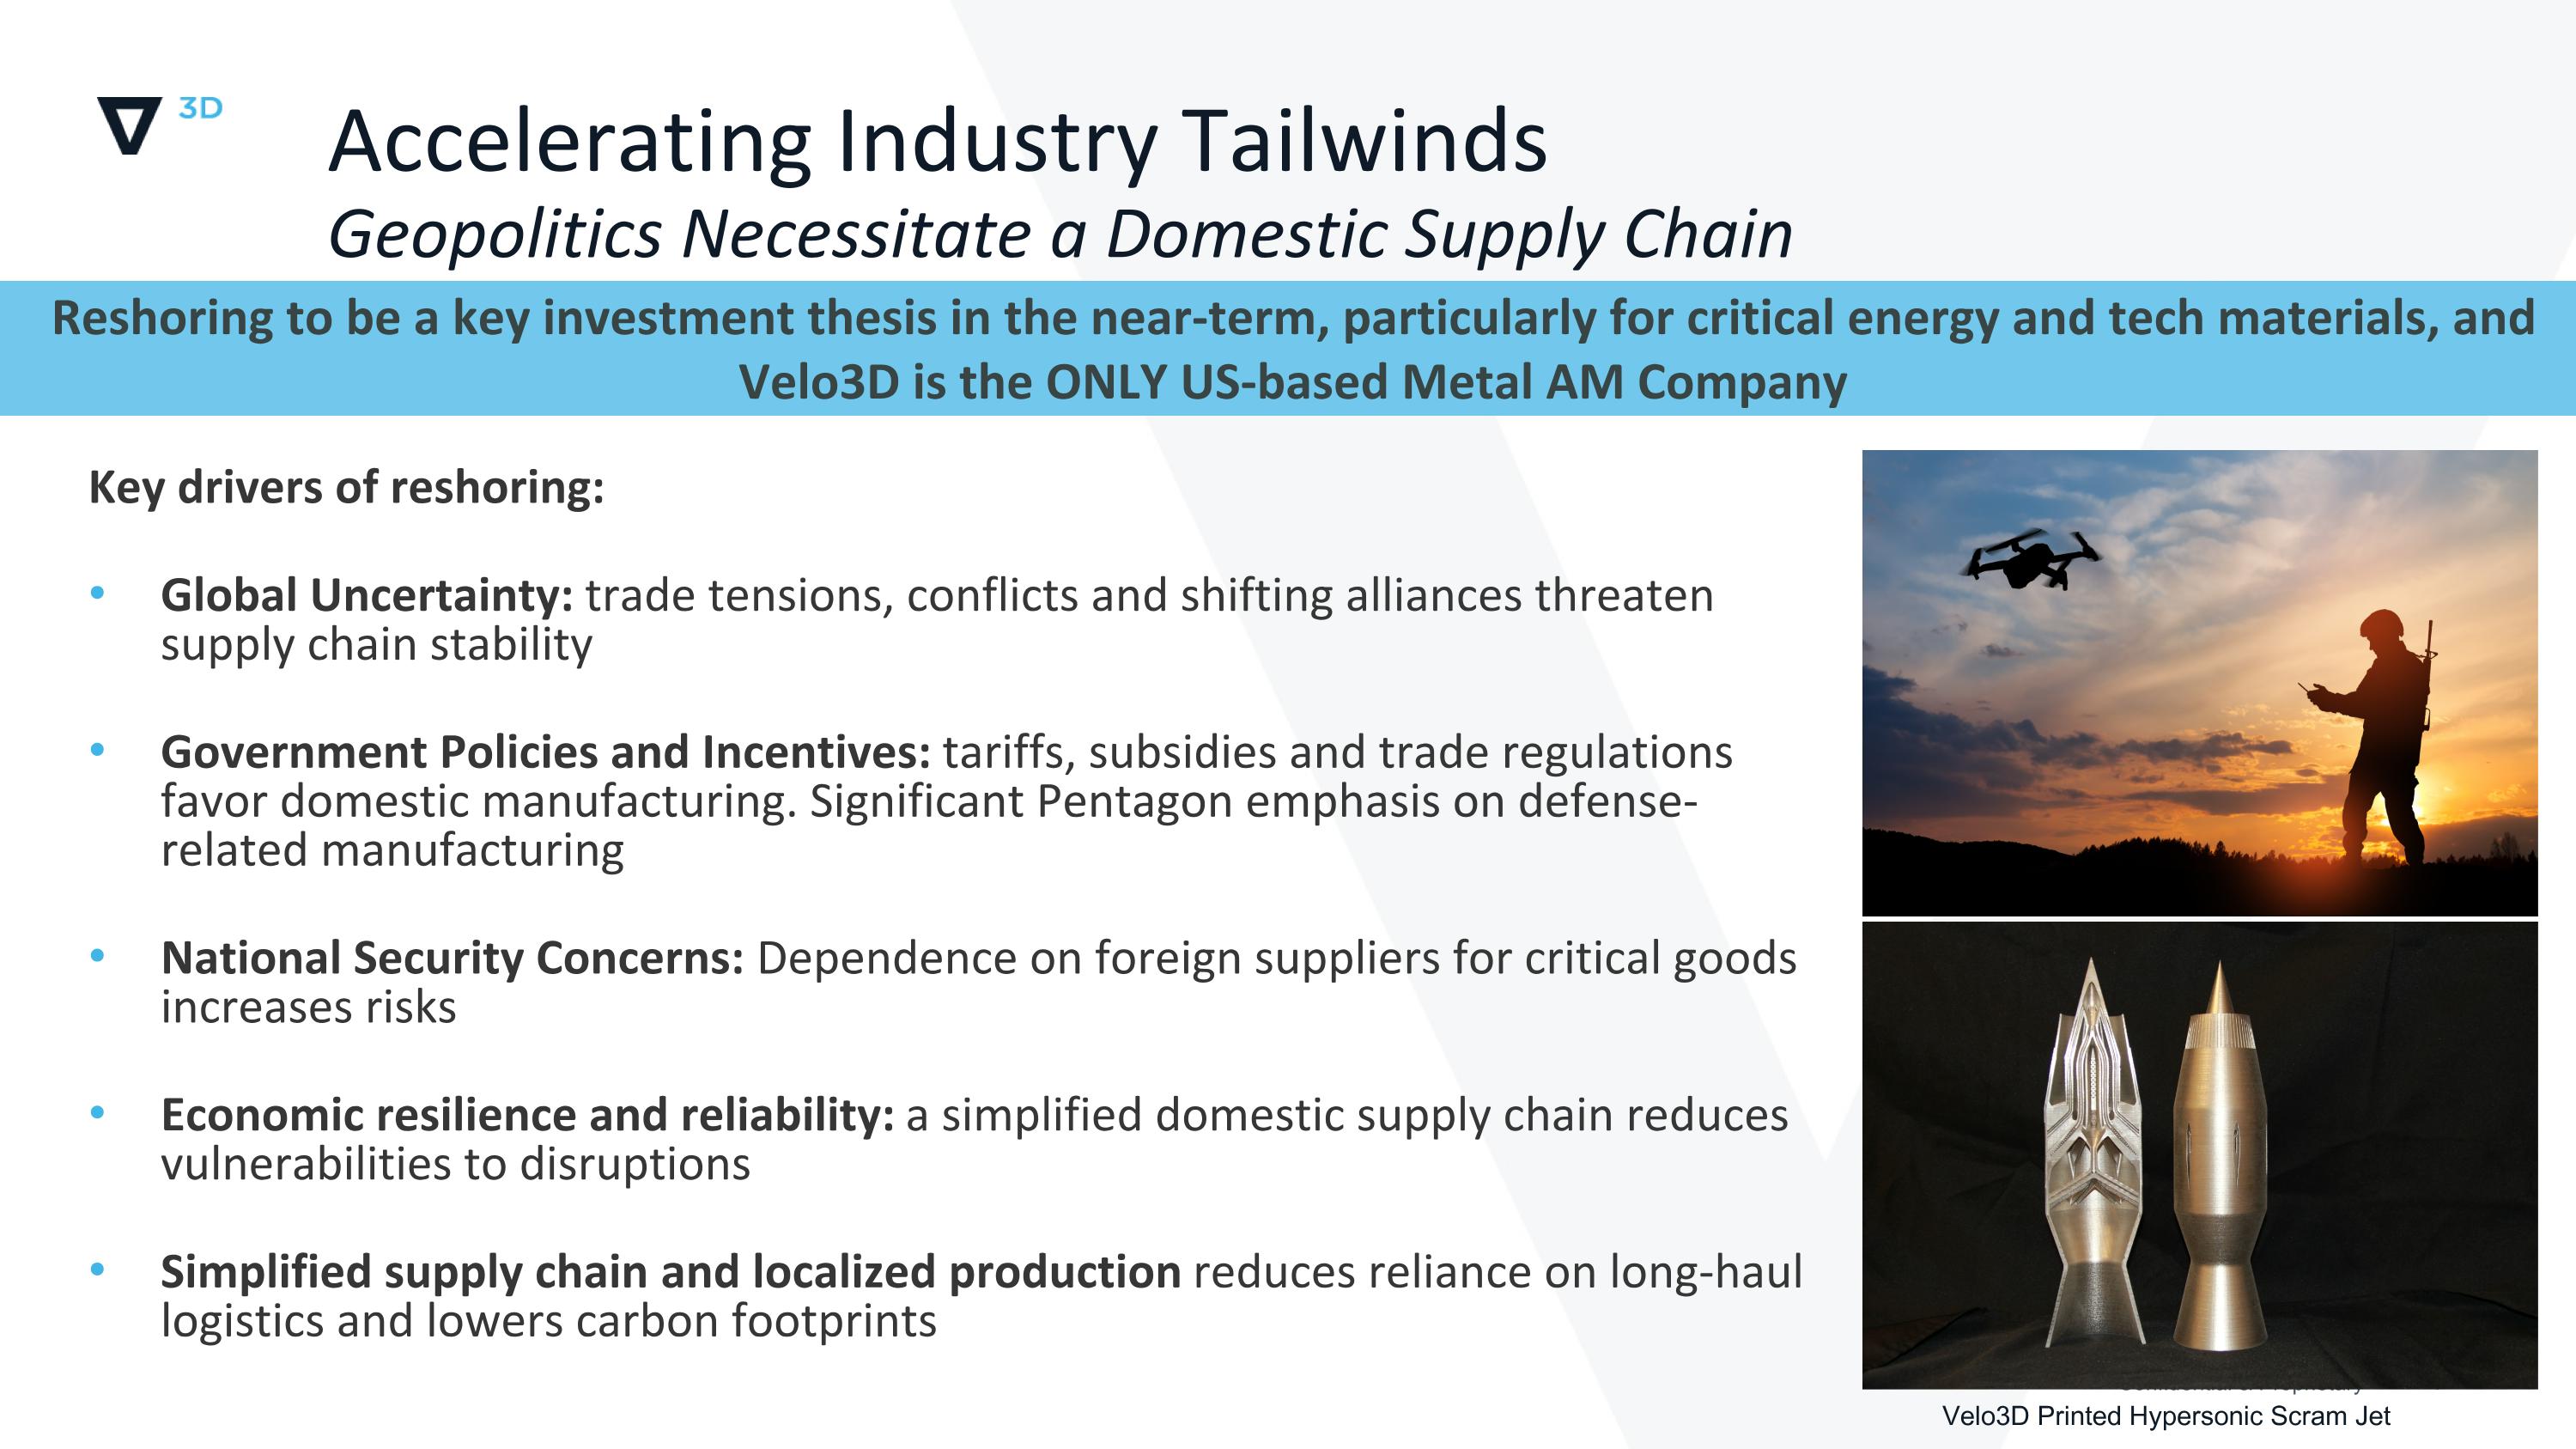
Accelerating Industry Tailwinds Geopolitics Necessitate a Domestic Supply Chain Confidential & Proprietary Key drivers of reshoring: Global Uncertainty: trade tensions, conflicts and shifting alliances threaten supply chain stability Government Policies and Incentives: tariffs, subsidies and trade regulations favor domestic manufacturing. Significant Pentagon emphasis on defense-related manufacturing National Security Concerns: Dependence on foreign suppliers for critical goods increases risks Economic resilience and reliability: a simplified domestic supply chain reduces vulnerabilities to disruptions Simplified supply chain and localized production reduces reliance on long-haul logistics and lowers carbon footprints Velo3D Printed Hypersonic Scram Jet Reshoring to be a key investment thesis in the near-term, particularly for critical energy and tech materials, and Velo3D is the ONLY US-based Metal AM Company
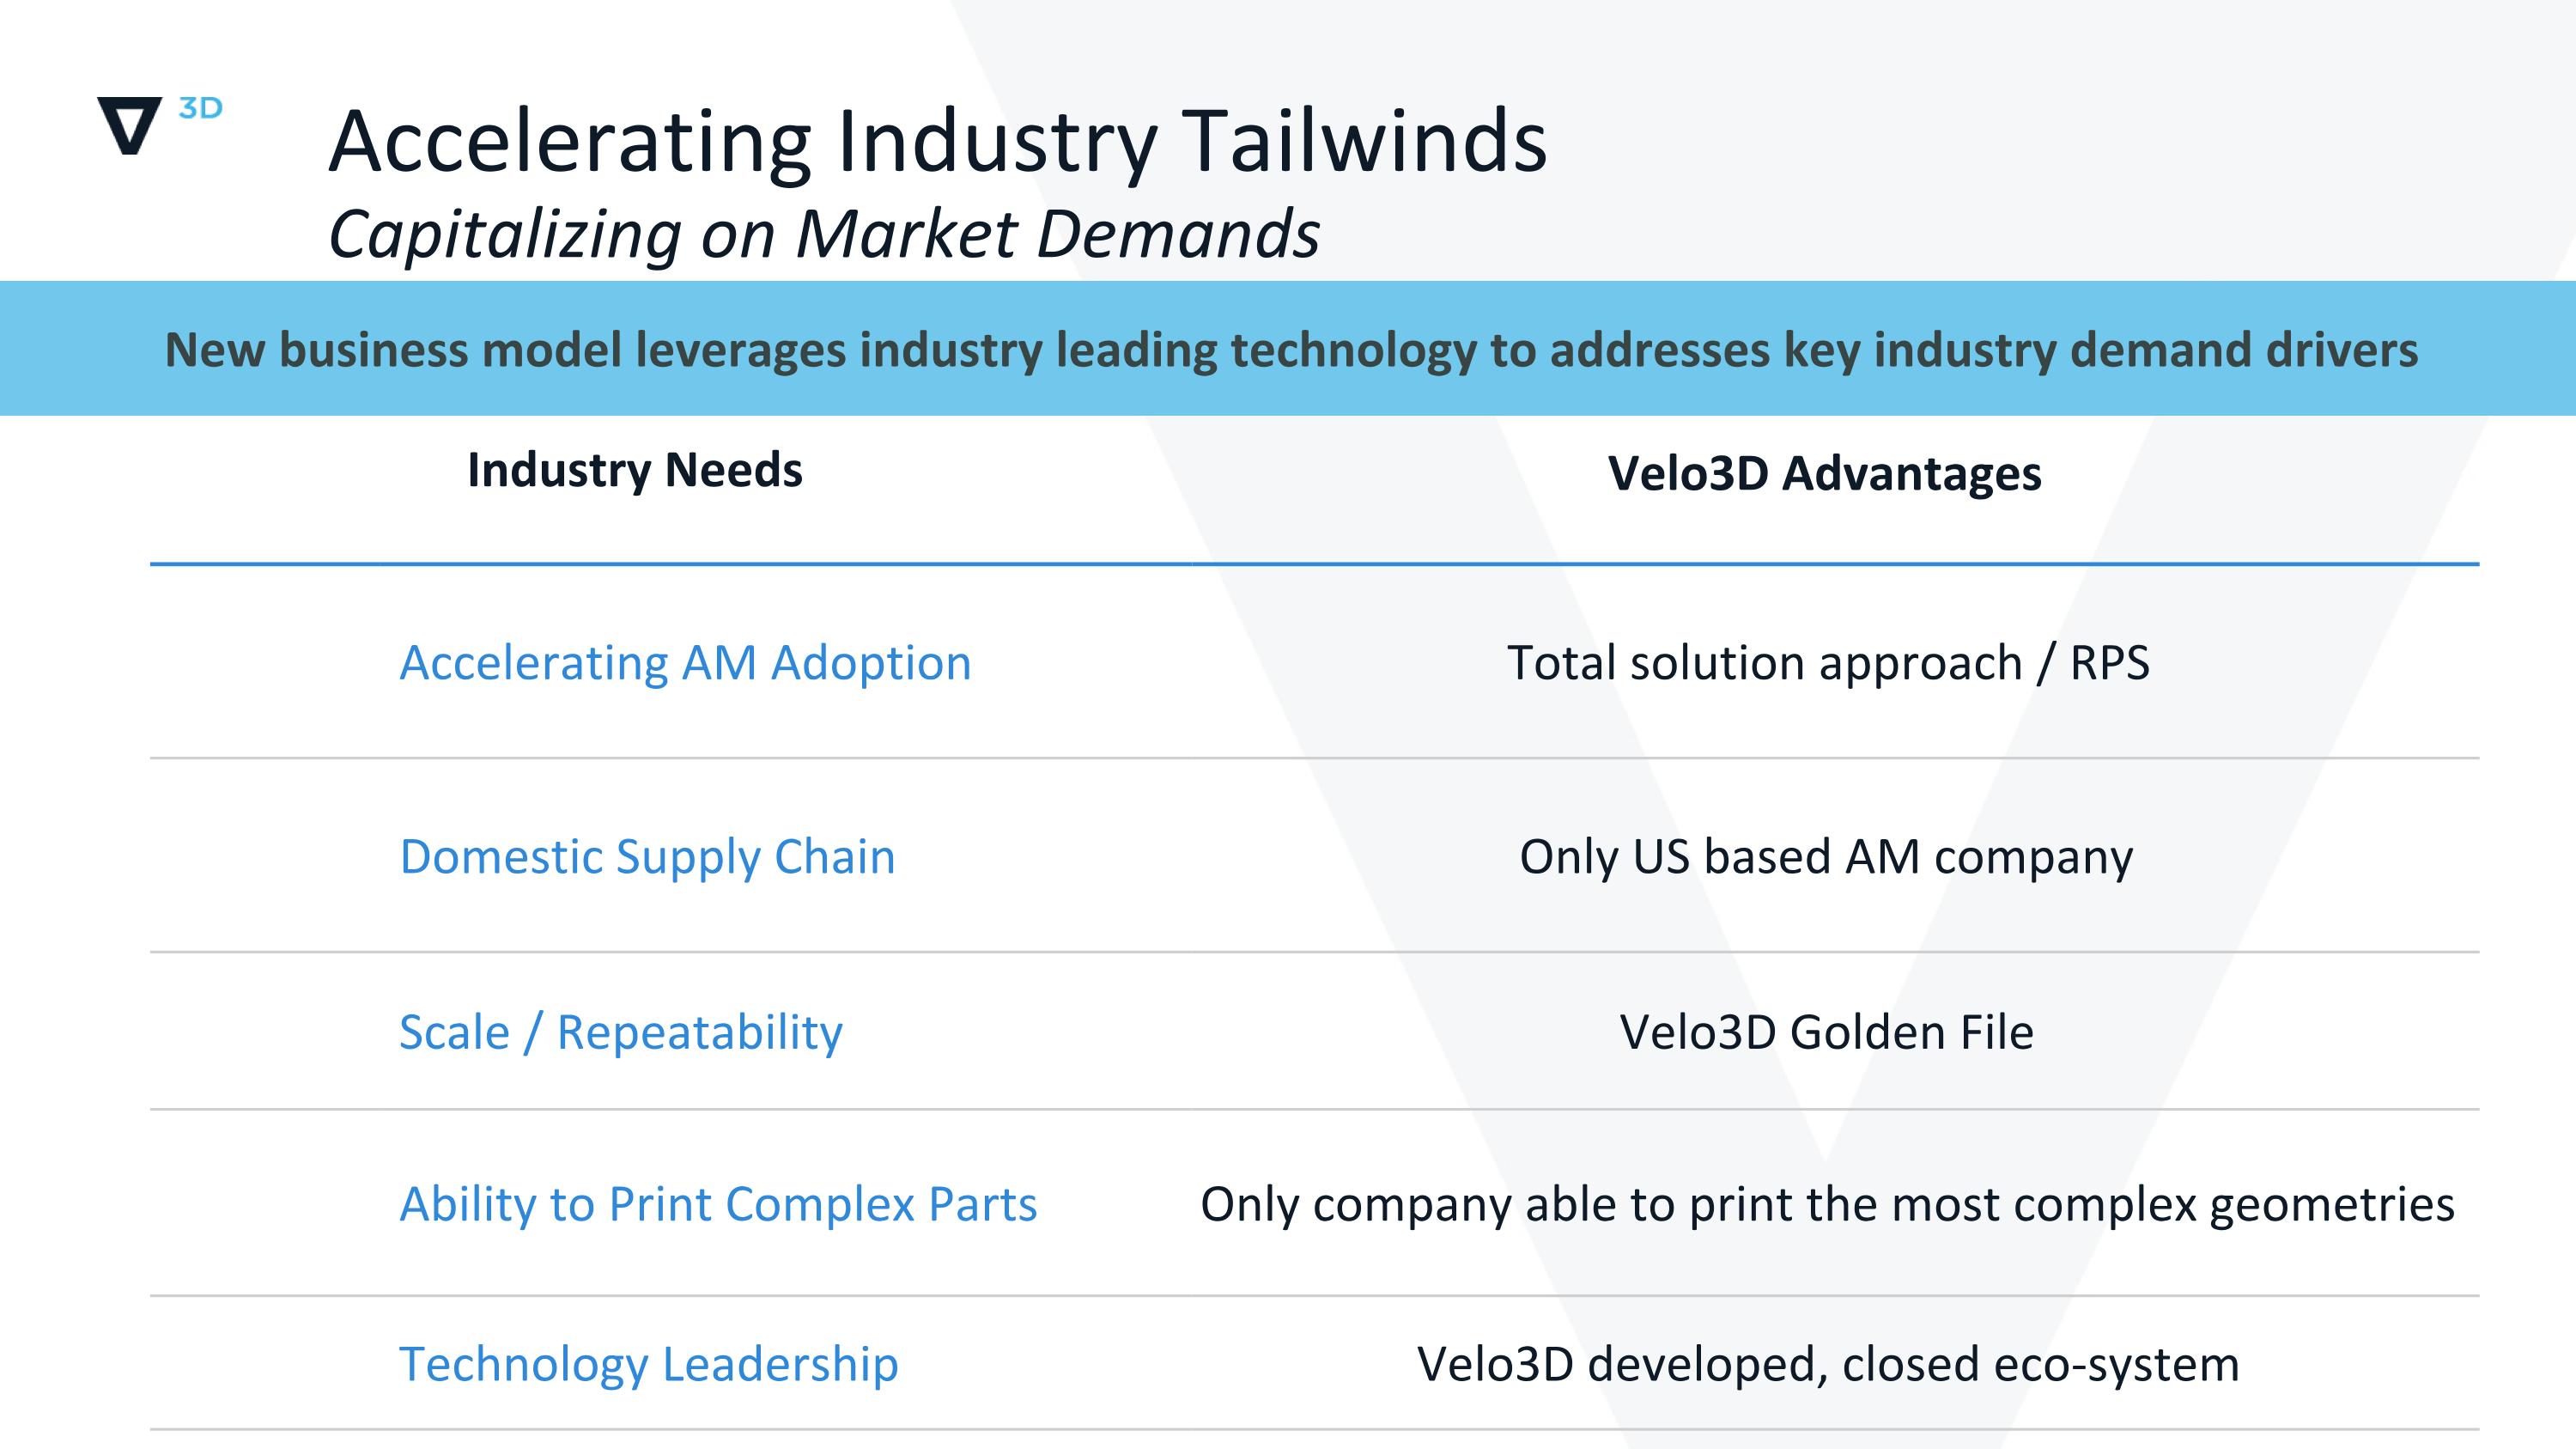
Accelerating AM Adoption Total solution approach / RPS Domestic Supply Chain Only US based AM company Scale / Repeatability Velo3D Golden File Ability to Print Complex Parts Only company able to print the most complex geometries Technology Leadership Velo3D developed, closed eco-system Accelerating Industry Tailwinds Capitalizing on Market Demands Velo3D Advantages Industry Needs New business model leverages industry leading technology to addresses key industry demand drivers
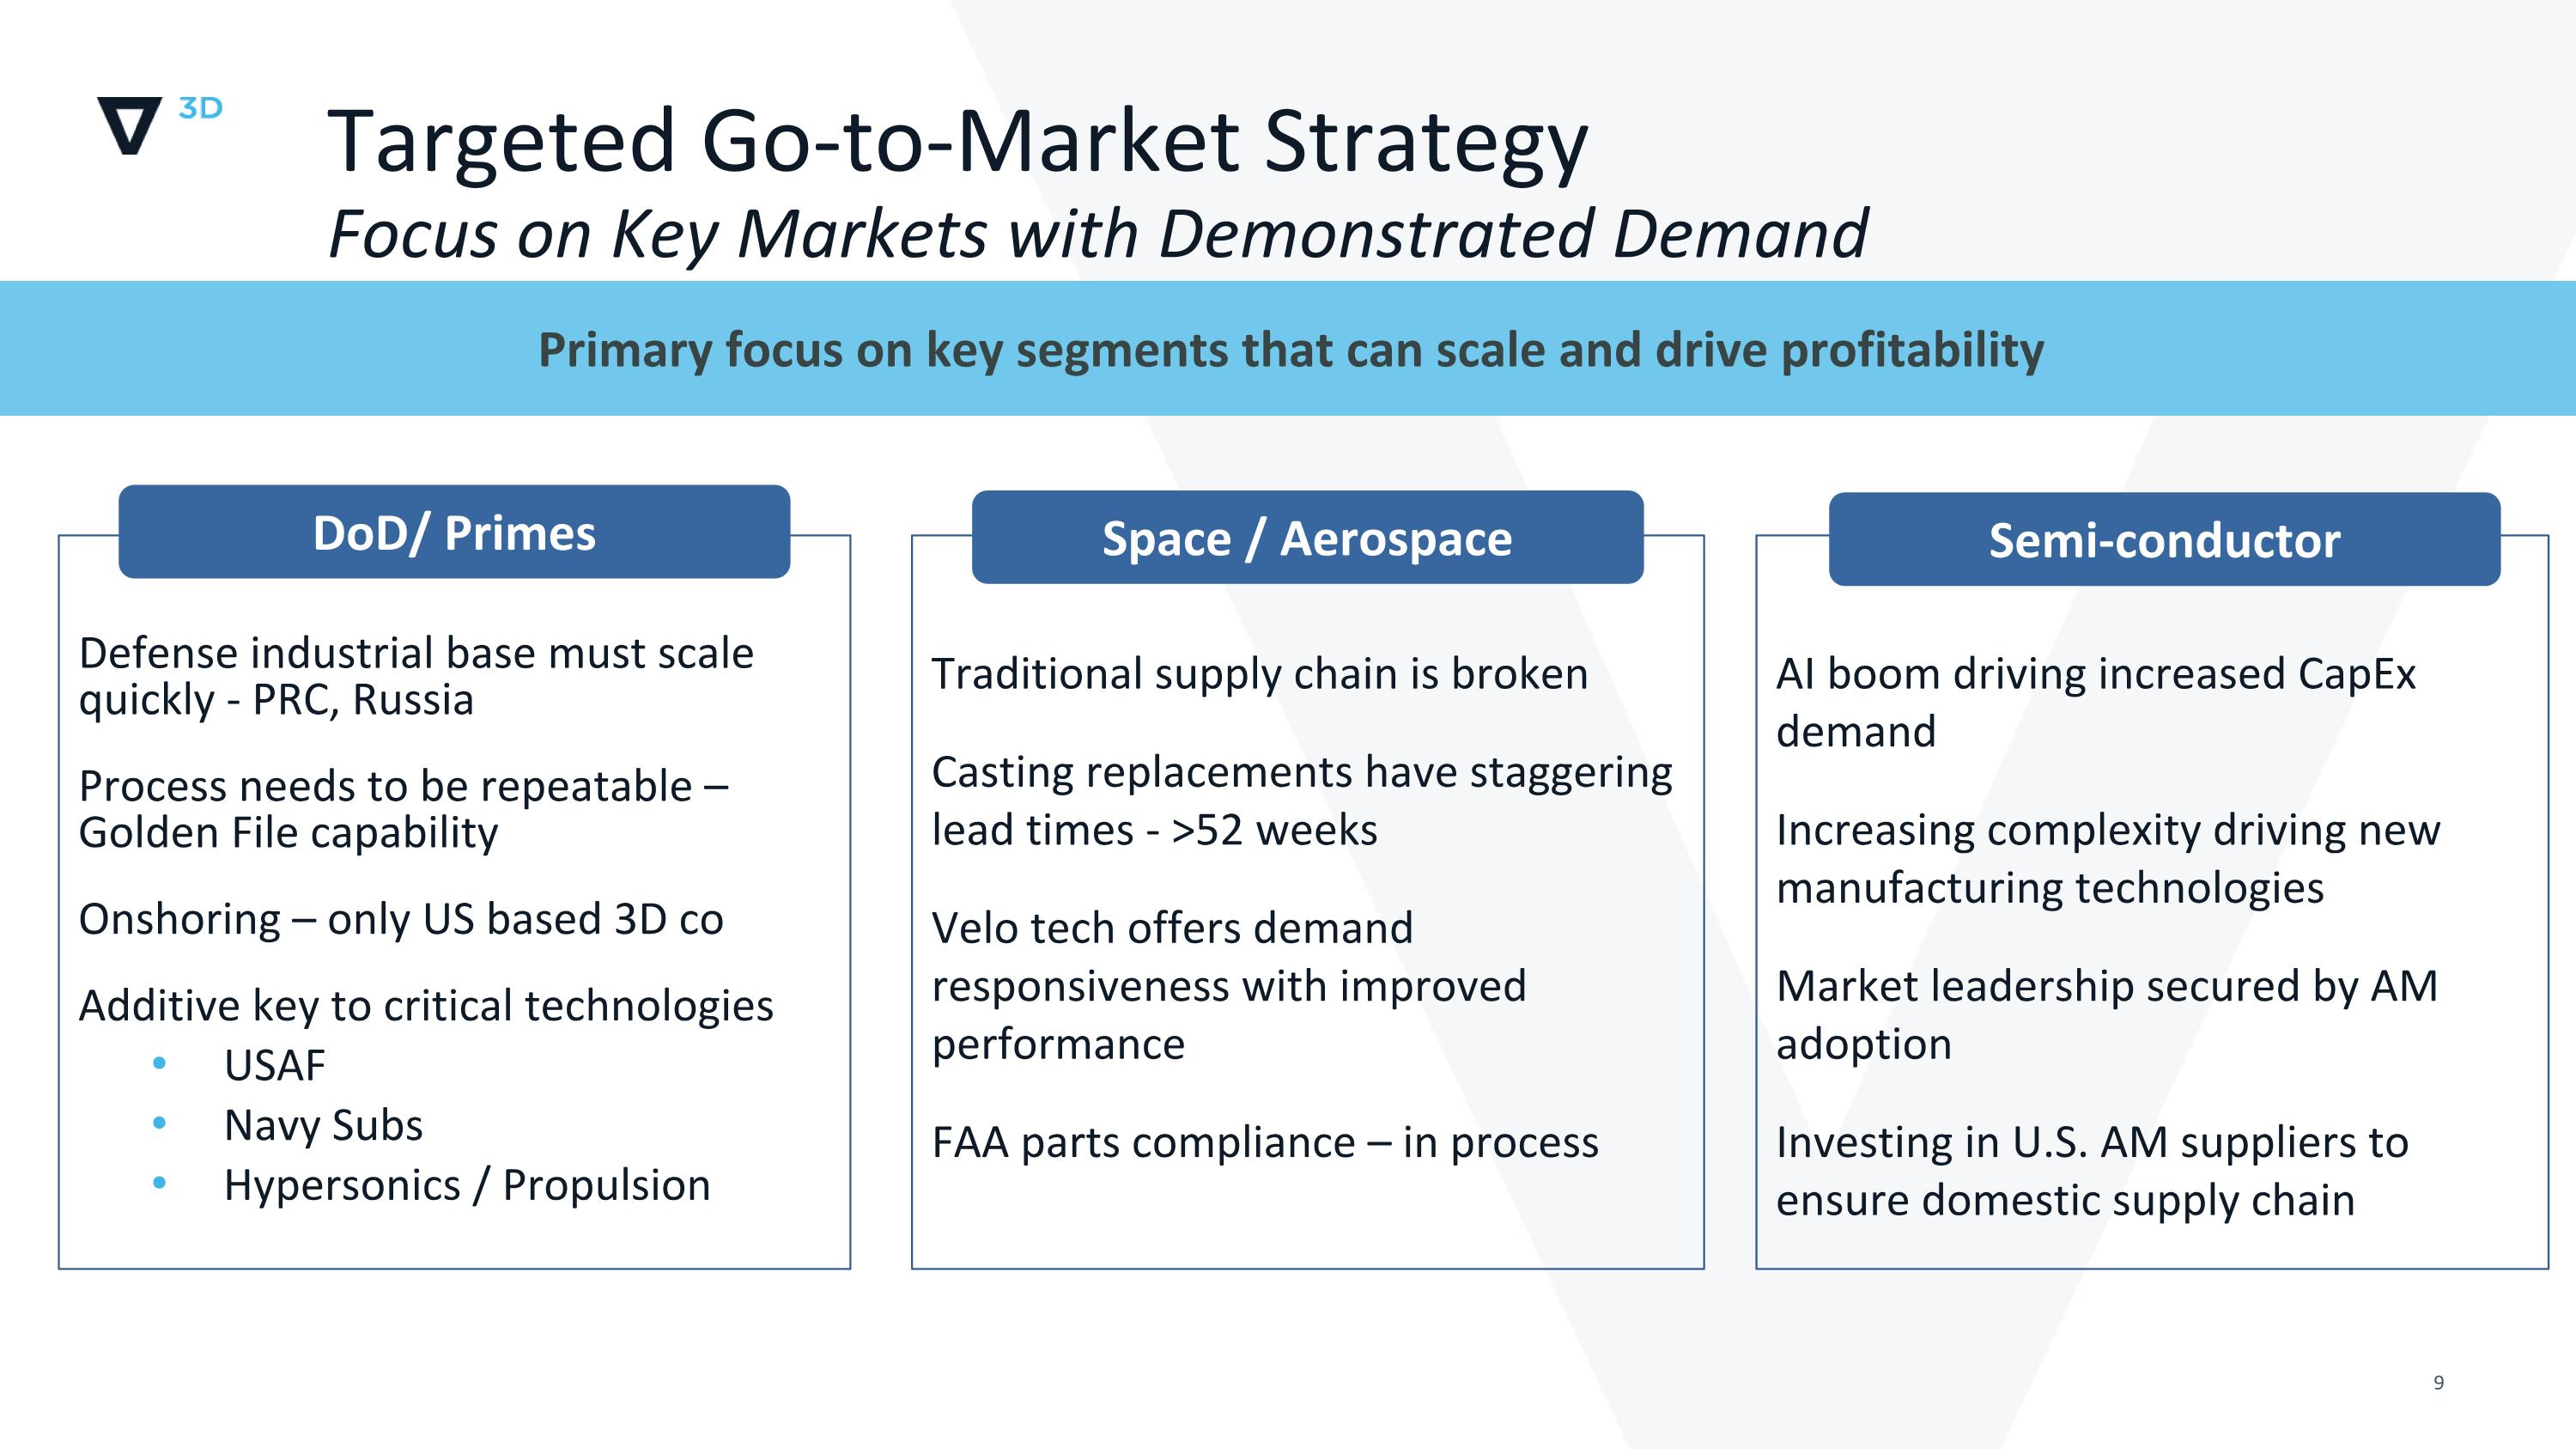
Targeted Go-to-Market Strategy Focus on Key Markets with Demonstrated Demand Defense industrial base must scale quickly - PRC, Russia Process needs to be repeatable – Golden File capability Onshoring – only US based 3D co Additive key to critical technologies USAF Navy Subs Hypersonics / Propulsion Traditional supply chain is broken Casting replacements have staggering lead times - >52 weeks Velo tech offers demand responsiveness with improved performance FAA parts compliance – in process AI boom driving increased CapEx demand Increasing complexity driving new manufacturing technologies Market leadership secured by AM adoption Investing in U.S. AM suppliers to ensure domestic supply chain Primary focus on key segments that can scale and drive profitability DoD/ Primes Space / Aerospace Semi-conductor
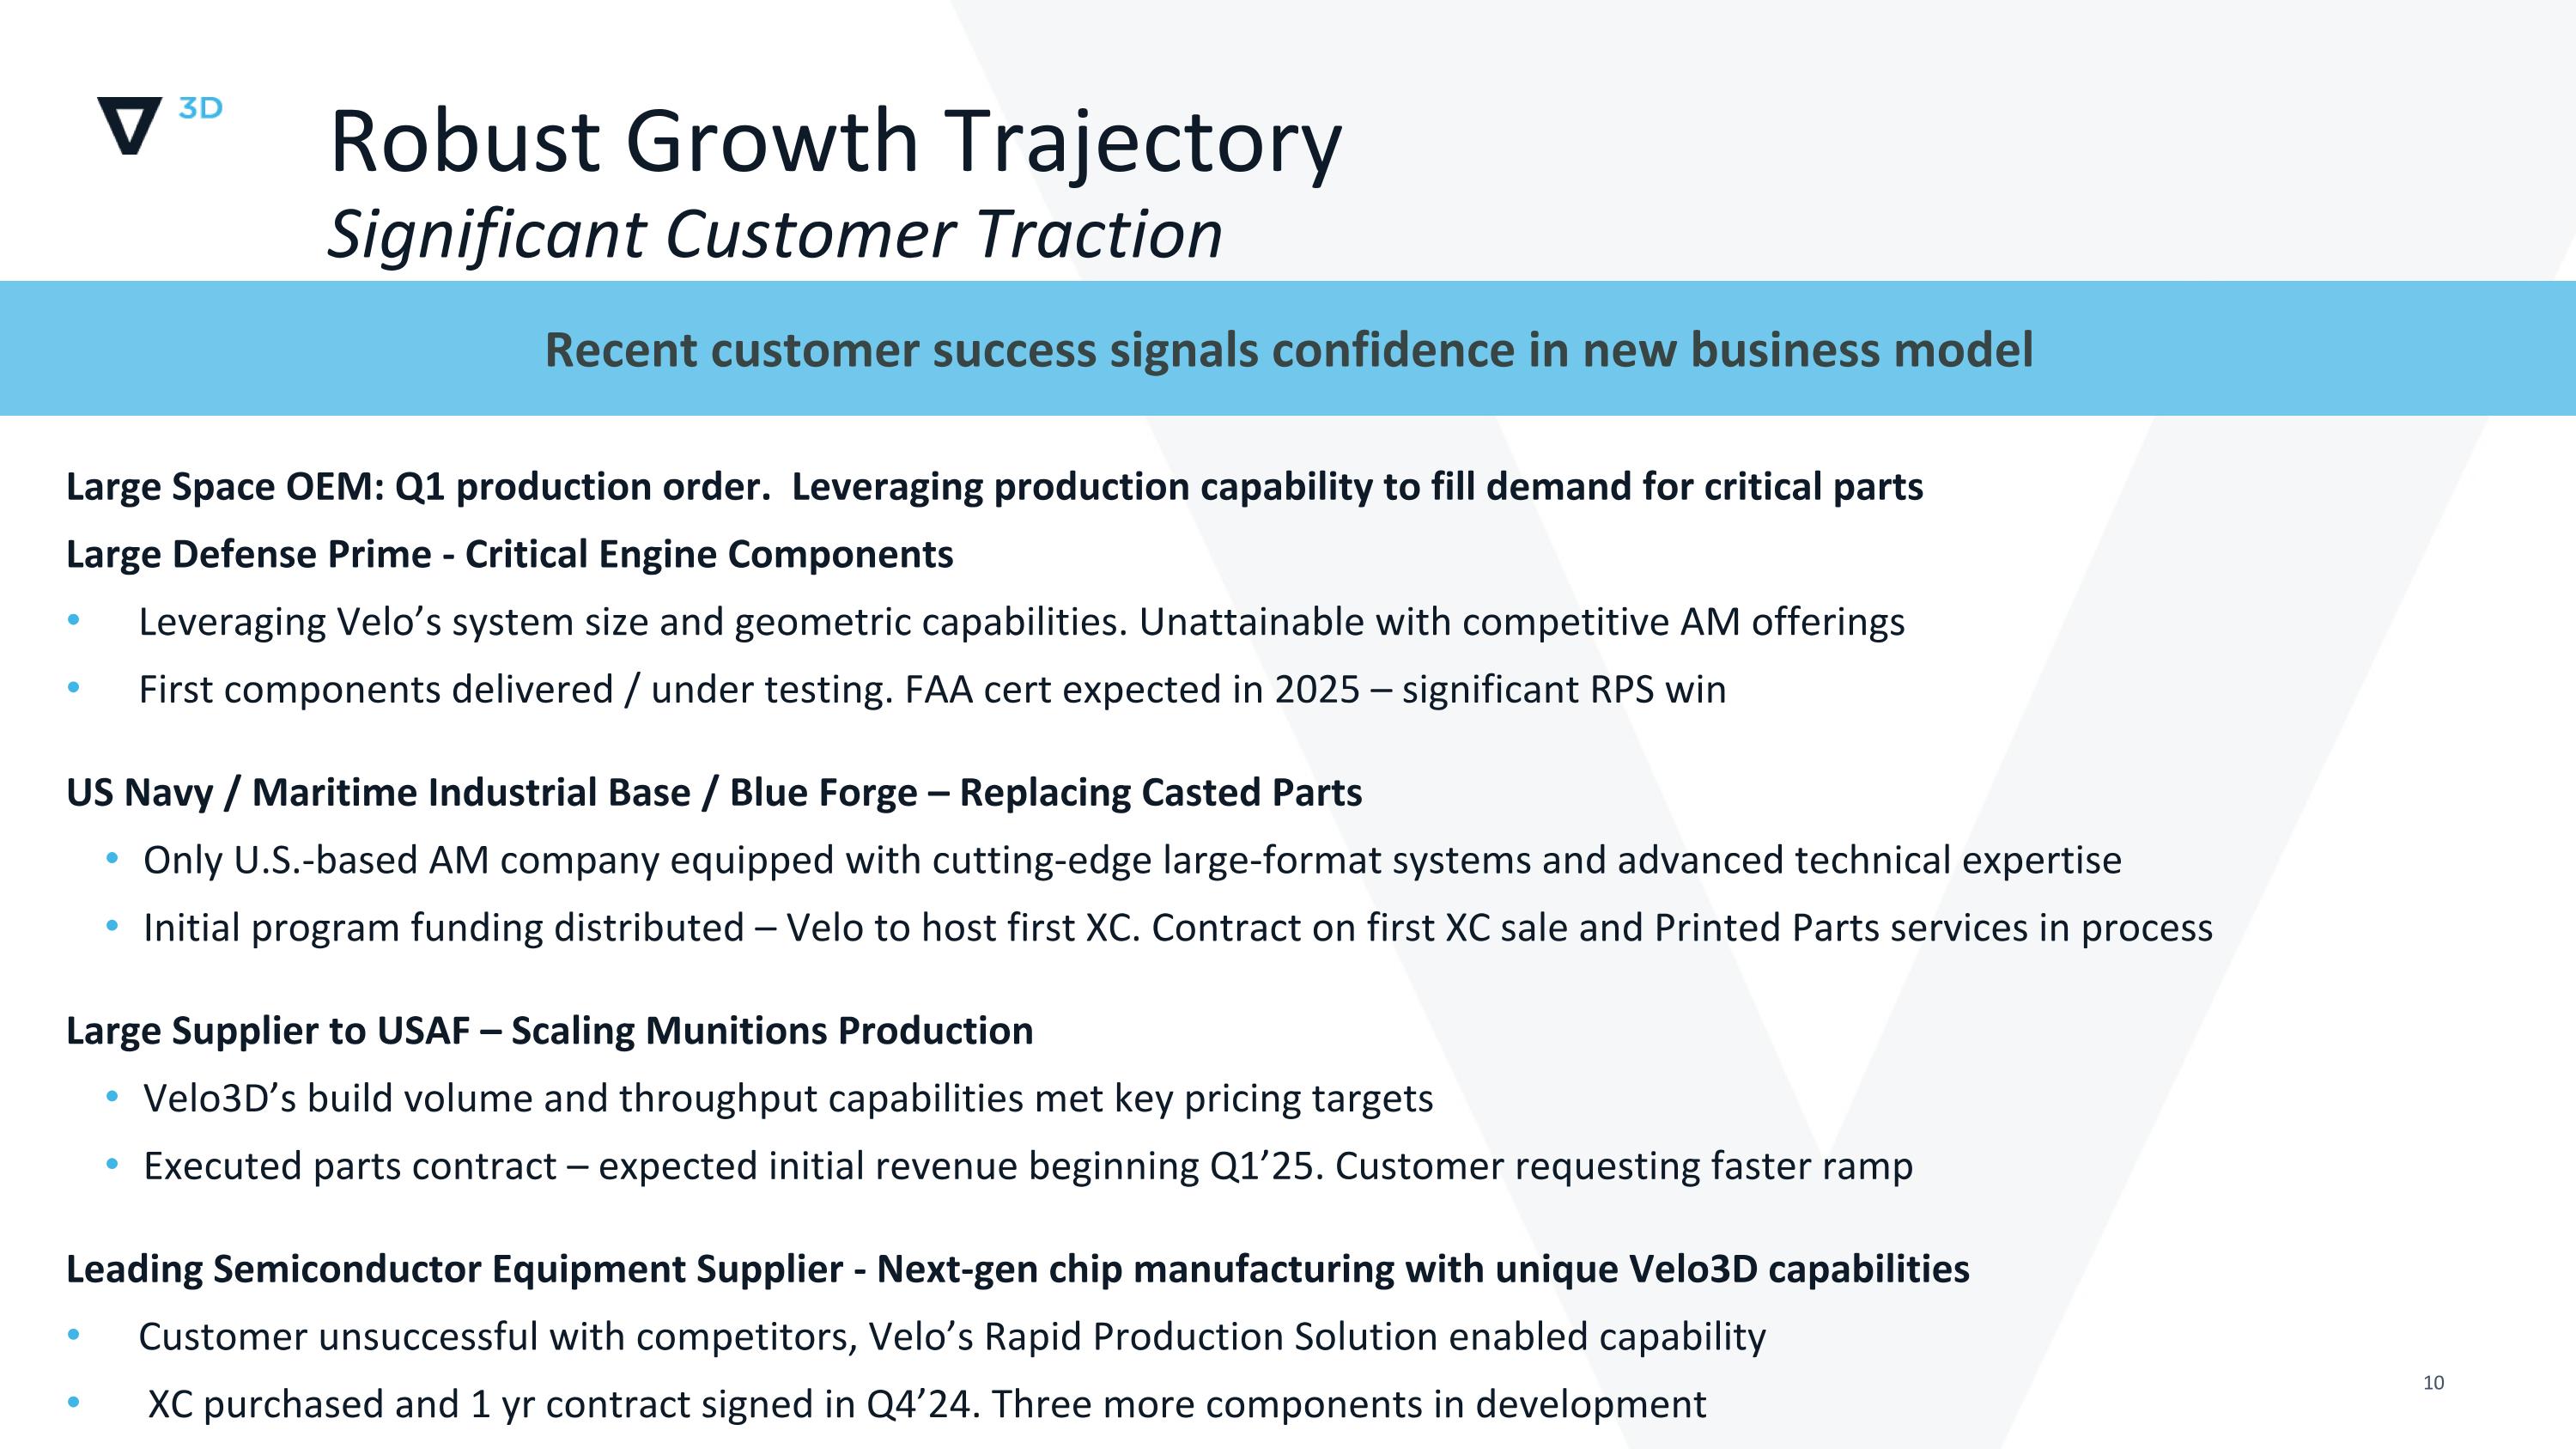
Robust Growth Trajectory Significant Customer Traction Large Space OEM: Q1 production order. Leveraging production capability to fill demand for critical parts Large Defense Prime - Critical Engine Components Leveraging Velo’s system size and geometric capabilities. Unattainable with competitive AM offerings First components delivered / under testing. FAA cert expected in 2025 – significant RPS win US Navy / Maritime Industrial Base / Blue Forge – Replacing Casted Parts Only U.S.-based AM company equipped with cutting-edge large-format systems and advanced technical expertise Initial program funding distributed – Velo to host first XC. Contract on first XC sale and Printed Parts services in process Large Supplier to USAF – Scaling Munitions Production Velo3D’s build volume and throughput capabilities met key pricing targets Executed parts contract – expected initial revenue beginning Q1’25. Customer requesting faster ramp Leading Semiconductor Equipment Supplier - Next-gen chip manufacturing with unique Velo3D capabilities Customer unsuccessful with competitors, Velo’s Rapid Production Solution enabled capability XC purchased and 1 yr contract signed in Q4’24. Three more components in development Recent customer success signals confidence in new business model
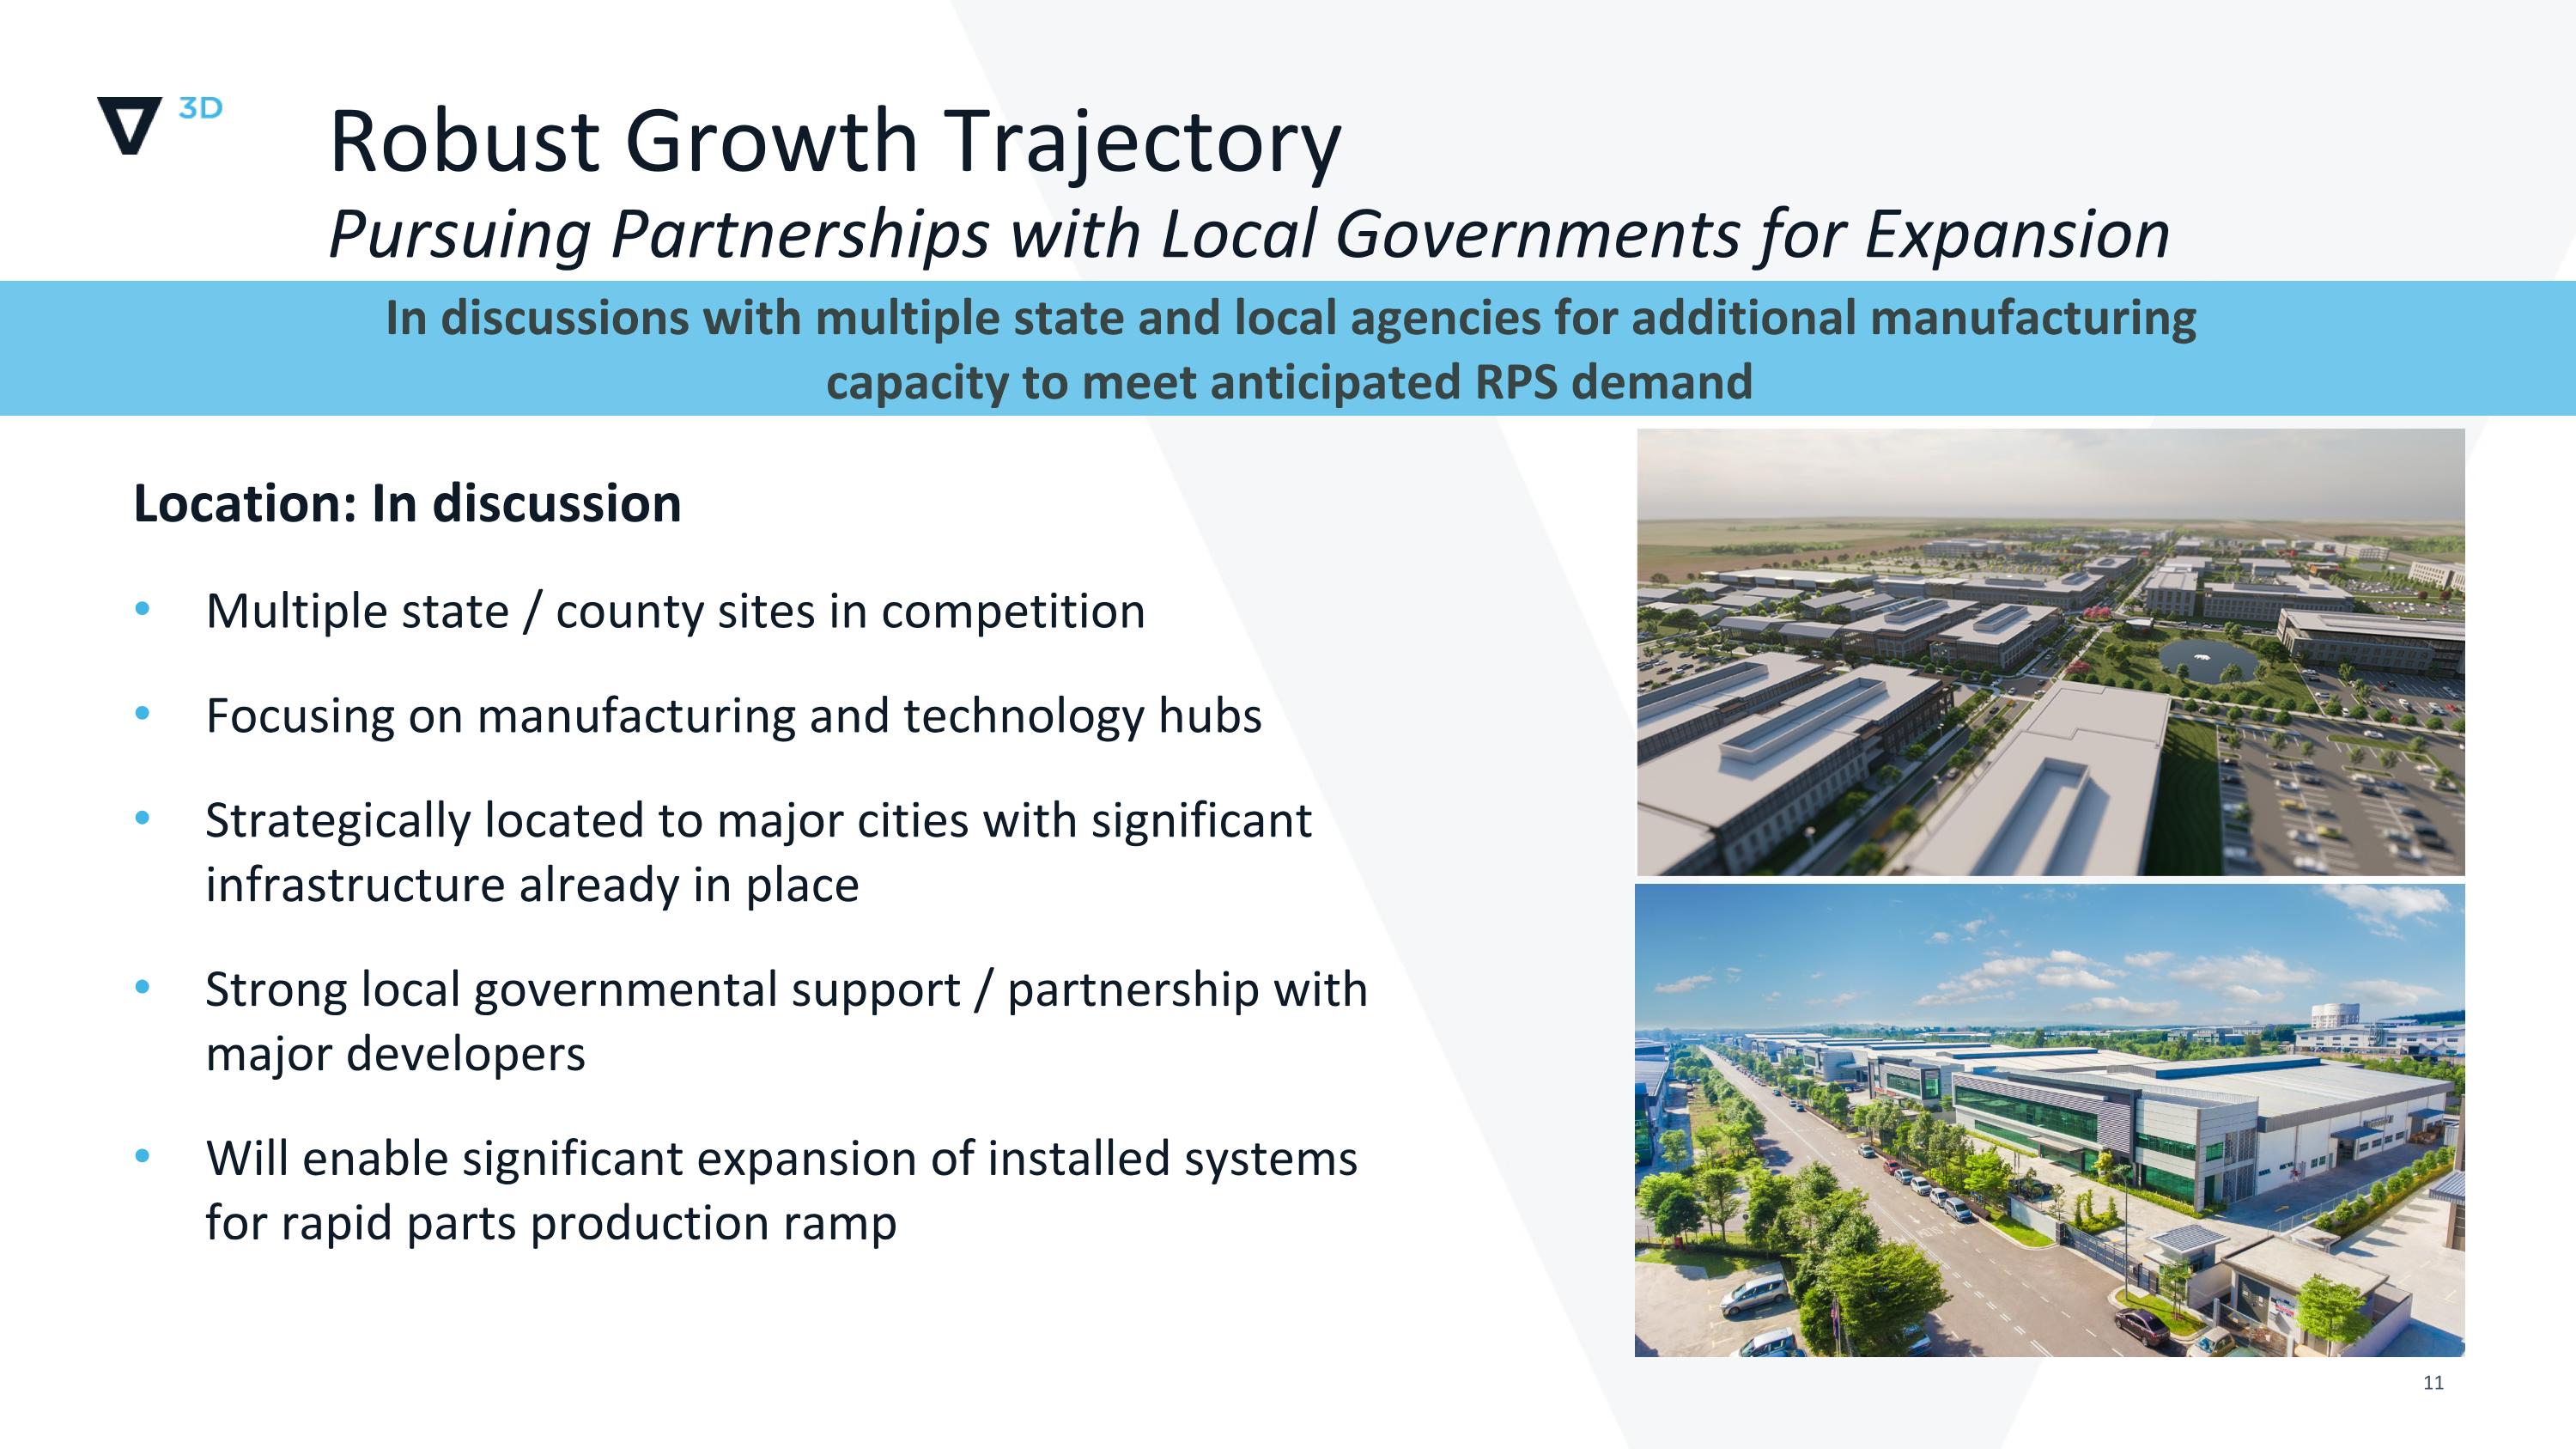
Robust Growth Trajectory Pursuing Partnerships with Local Governments for Expansion Location: In discussion Multiple state / county sites in competition Focusing on manufacturing and technology hubs Strategically located to major cities with significant infrastructure already in place Strong local governmental support / partnership with major developers Will enable significant expansion of installed systems for rapid parts production ramp In discussions with multiple state and local agencies for additional manufacturing capacity to meet anticipated RPS demand
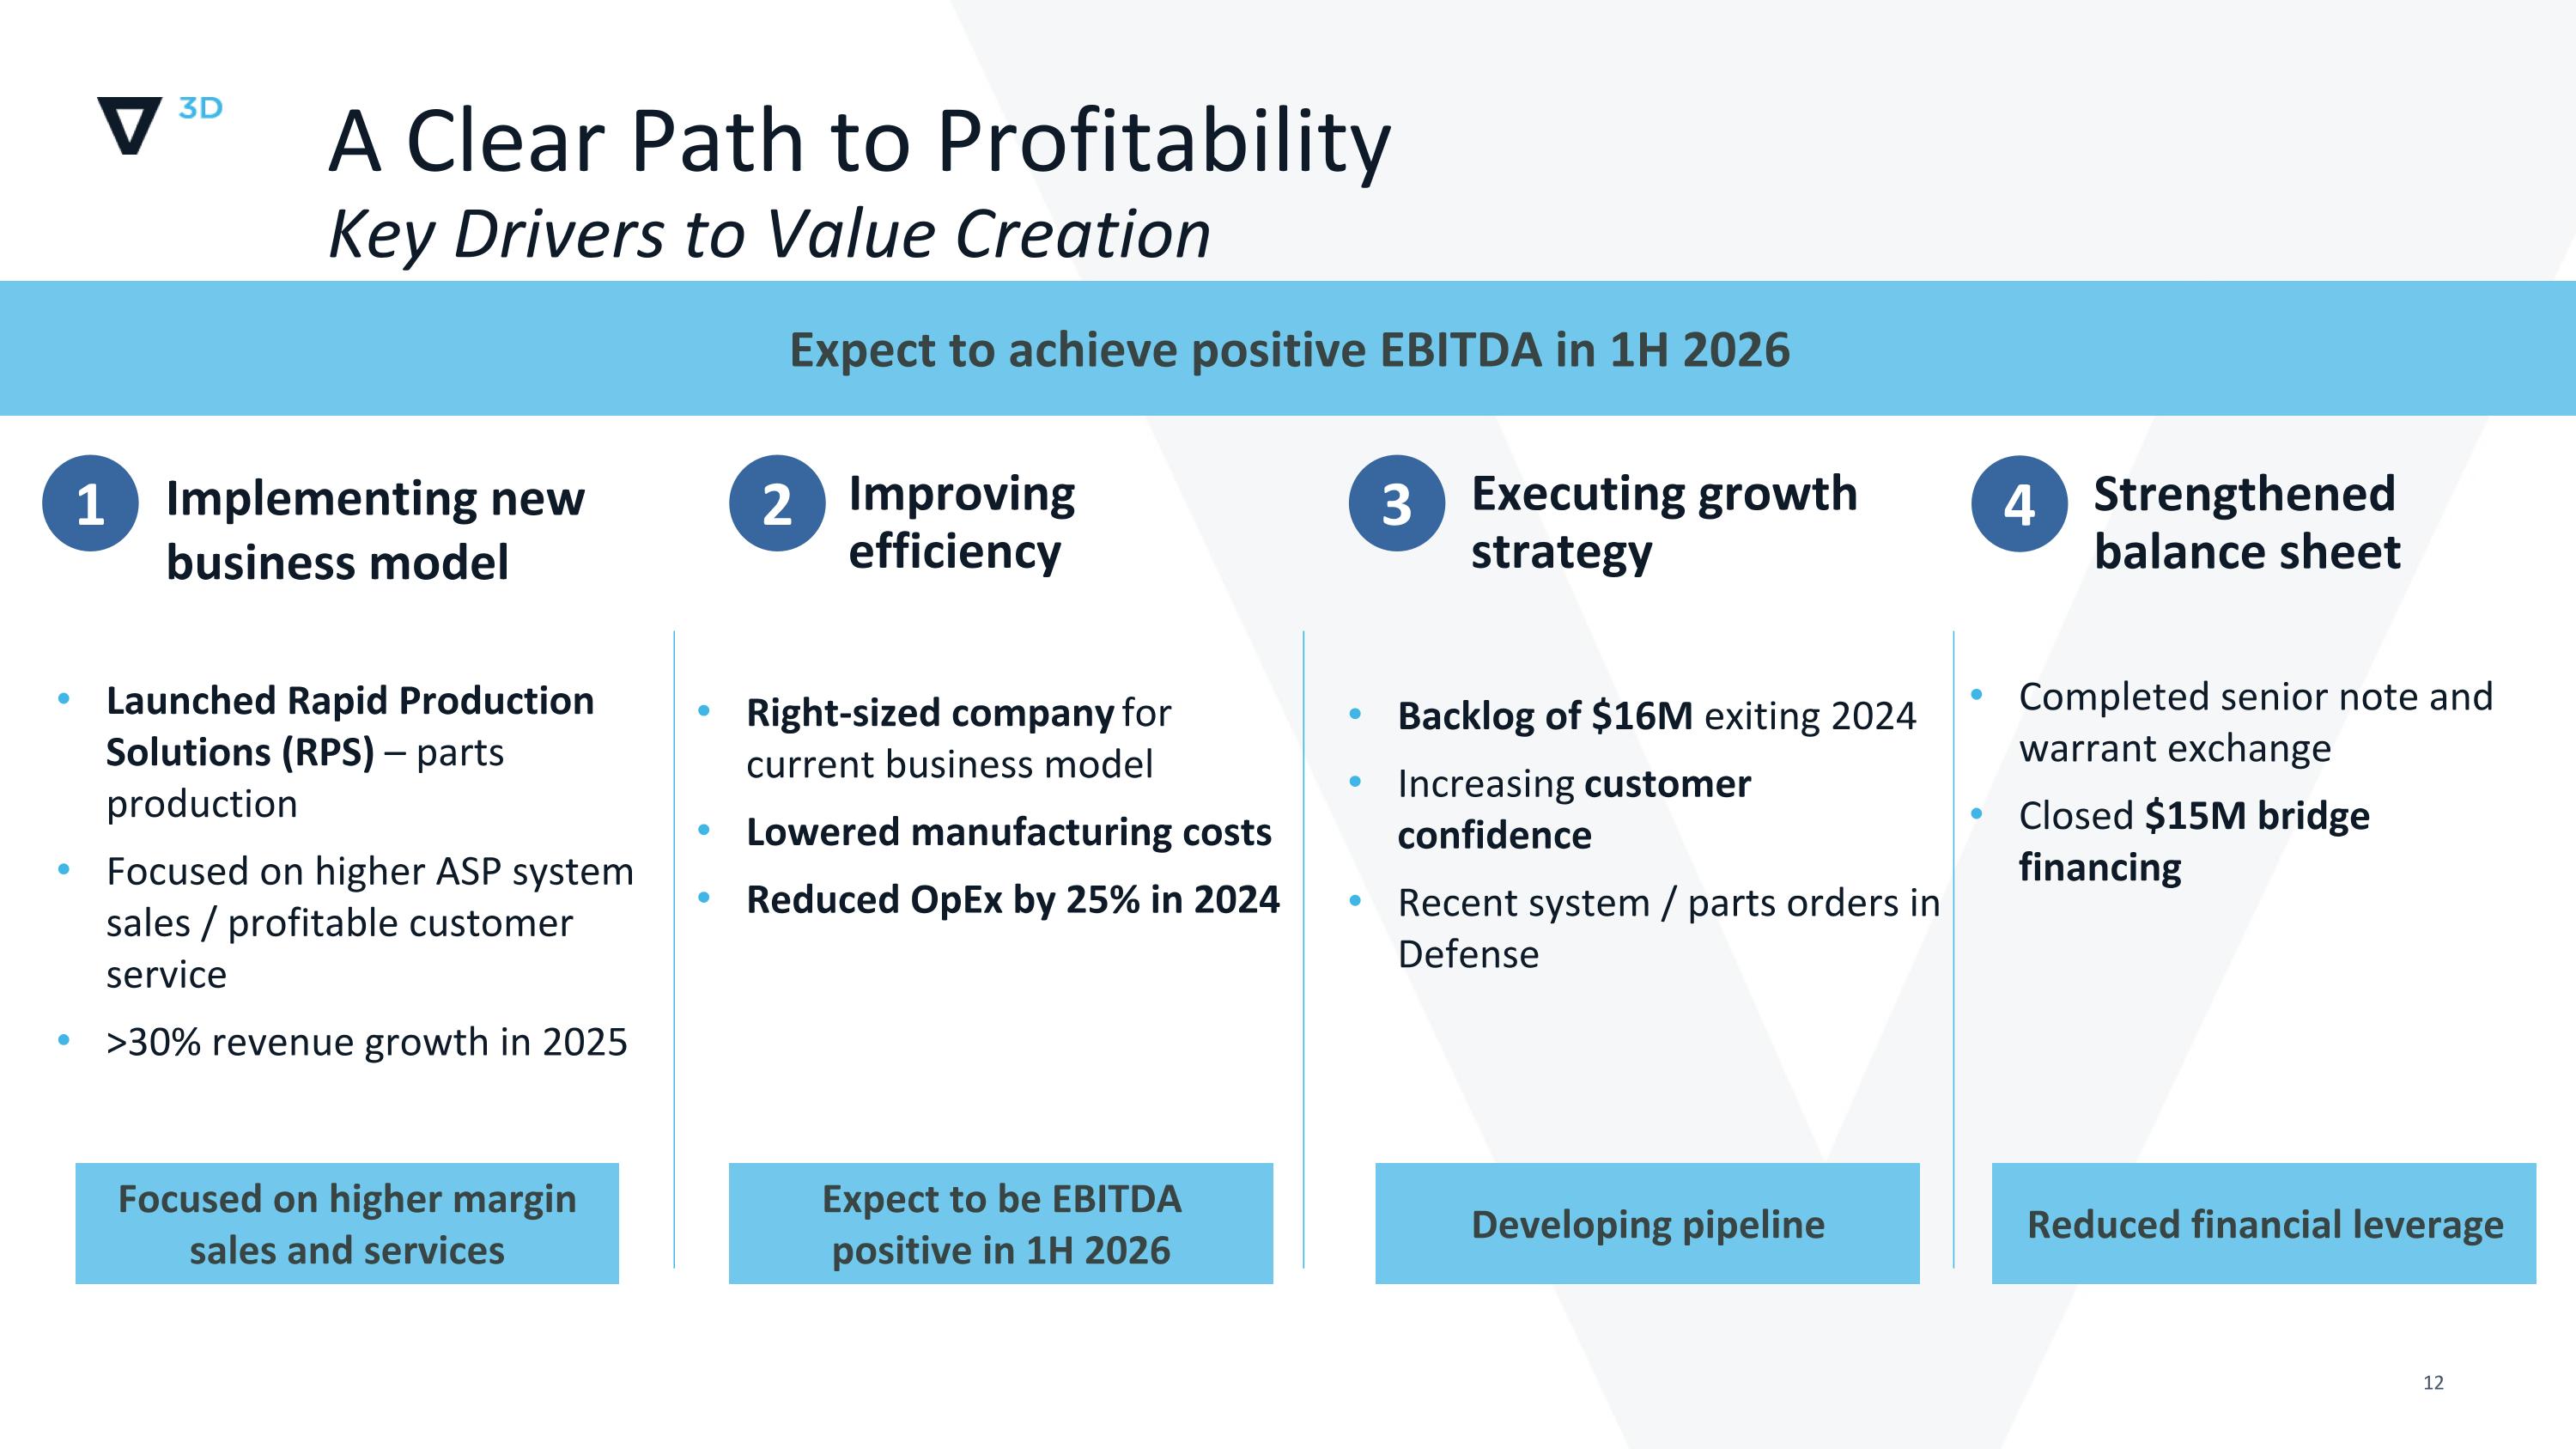
Launched Rapid Production Solutions (RPS) – parts production Focused on higher ASP system sales / profitable customer service >30% revenue growth in 2025 Expect to achieve positive EBITDA in 1H 2026 1 Implementing new business model 2 Improving efficiency 3 Executing growth strategy Right-sized company for current business model Lowered manufacturing costs Reduced OpEx by 25% in 2024 Backlog of $16M exiting 2024 Increasing customer confidence Recent system / parts orders in Defense 4 Strengthened balance sheet Completed senior note and warrant exchange Closed $15M bridge financing Expect to be EBITDA positive in 1H 2026 Focused on higher margin sales and services Developing pipeline Reduced financial leverage A Clear Path to Profitability Key Drivers to Value Creation

Confidential & Proprietary | Financials Overview New
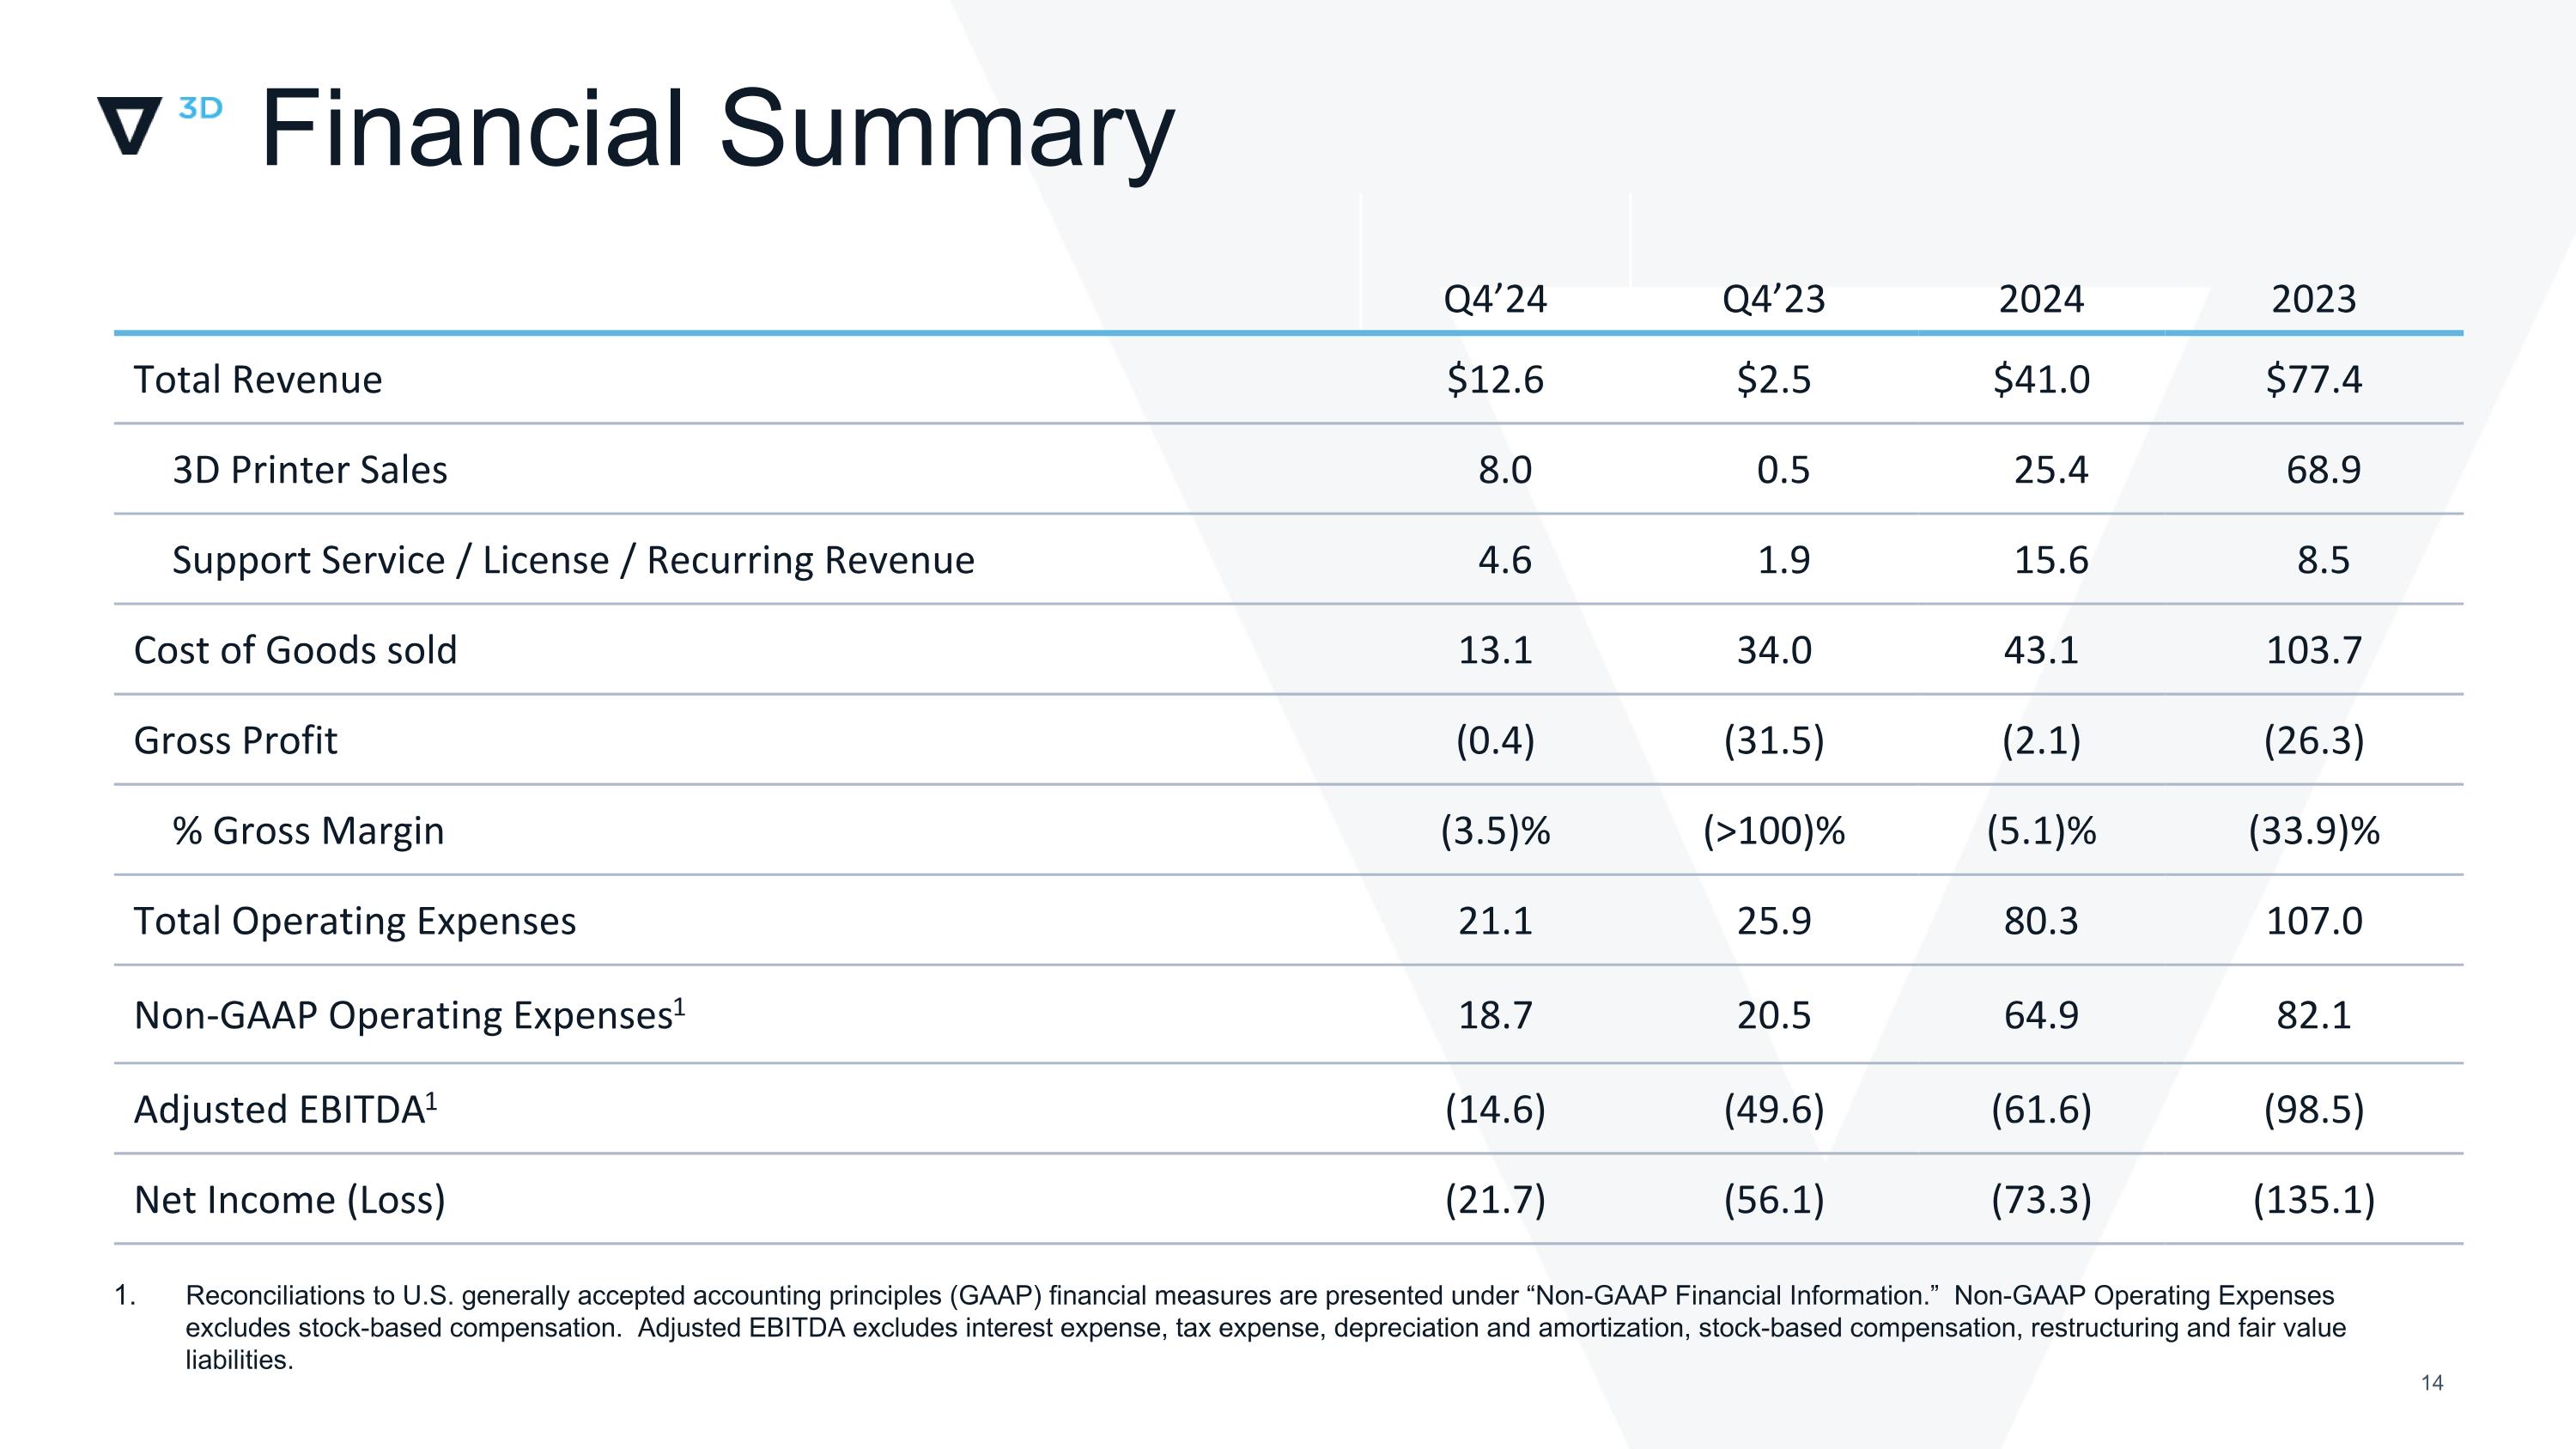
Financial Summary Reconciliations to U.S. generally accepted accounting principles (GAAP) financial measures are presented under “Non-GAAP Financial Information.” Non-GAAP Operating Expenses excludes stock-based compensation. Adjusted EBITDA excludes interest expense, tax expense, depreciation and amortization, stock-based compensation, restructuring and fair value liabilities. Q4’24 Q4’23 2024 2023 Total Revenue $12.6 $2.5 $41.0 $77.4 3D Printer Sales 8.0 0.5 25.4 68.9 Support Service / License / Recurring Revenue 4.6 1.9 15.6 8.5 Cost of Goods sold 13.1 34.0 43.1 103.7 Gross Profit (0.4) (31.5) (2.1) (26.3) % Gross Margin (3.5)% (>100)% (5.1)% (33.9)% Total Operating Expenses 21.1 25.9 80.3 107.0 Non-GAAP Operating Expenses1 18.7 20.5 64.9 82.1 Adjusted EBITDA1 (14.6) (49.6) (61.6) (98.5) Net Income (Loss) (21.7) (56.1) (73.3) (135.1)
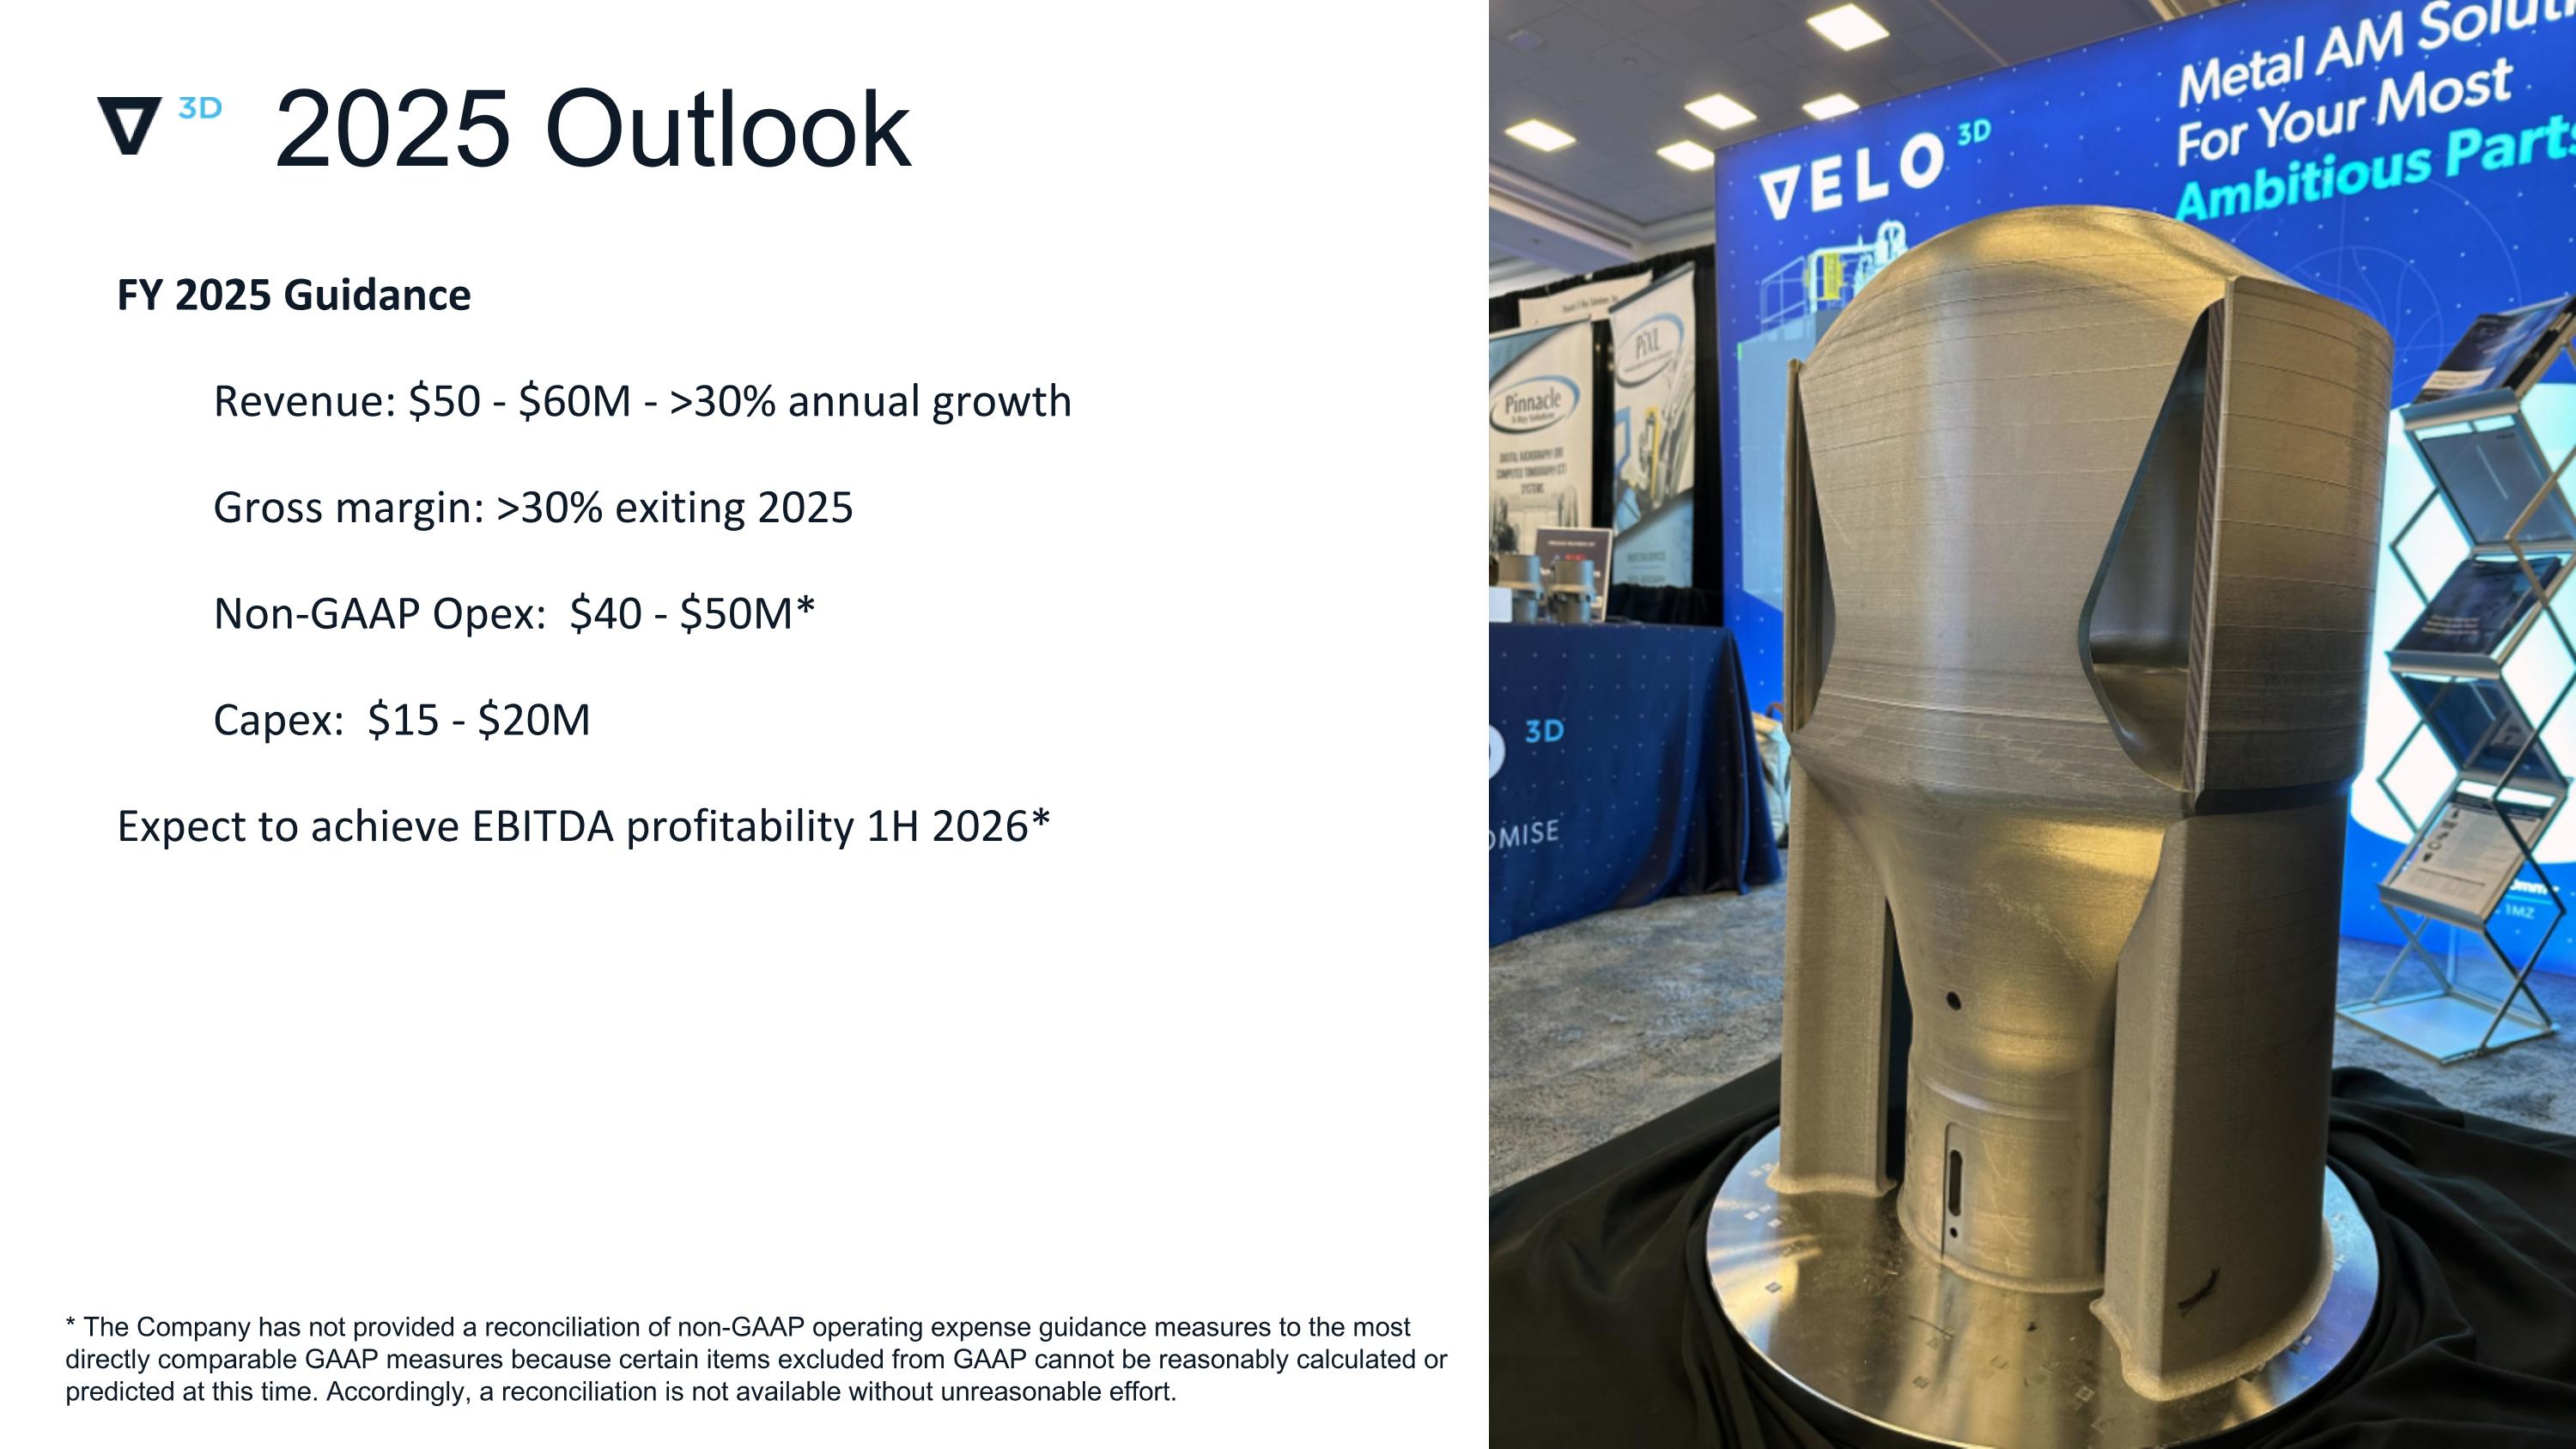
2023 Outlook * Q423 / FY 2023 gross margin ranges excludes impact from non-recurring charges 2025 Outlook FY 2025 Guidance Revenue: $50 - $60M - >30% annual growth Gross margin: >30% exiting 2025 Non-GAAP Opex: $40 - $50M* Capex: $15 - $20M Expect to achieve EBITDA profitability 1H 2026* * The Company has not provided a reconciliation of non-GAAP operating expense guidance measures to the most directly comparable GAAP measures because certain items excluded from GAAP cannot be reasonably calculated or predicted at this time. Accordingly, a reconciliation is not available without unreasonable effort.

Thank You! March 31, 2025
Disclaimer Non-GAAP Financial Information The Company uses non-GAAP financial measures, such as Non-GAAP / Adjusted operating expenses, EBITDA, Adjusted EBITDA, Adjusted EBITDA excluding merger related transactional costs, loss on convertible note modification, and Non-GAAP net (loss), to help it make strategic decisions, establish budgets and operational goals for managing its business, analyze its financial results and evaluate its performance. The Company also believes that the presentation of these non-GAAP financial measures in this presentation provides an additional tool for investors to use in comparing the Company’s core business and results of operations over multiple periods. However, the non-GAAP financial measures presented in this presentation may not be comparable to similarly titled measures reported by other companies due to differences in the way that these measures are calculated. The non-GAAP financial measures presented in this presentation should not be considered as the sole measure of the Company’s performance and should not be considered in isolation from, or as a substitute for, comparable financial measures calculated in accordance with generally accepted accounting principles accepted in the United States (“GAAP”). For reconciliations of these non-GAAP financial measures to the Company’s GAAP financial measures, see Appendix to this presentation. You should review these reconciliations and not rely on any single financial measure to evaluate the Company business. Industry and Market Data In this presentation, the Company relies on and refers to publicly available information and statistics regarding the market in which the Company competes and other industry data. The Company obtained this information and statistics from third-party sources, including reports by market research firms and company filings. While the Company believes such third-party information is reliable, there can be no assurance as to the accuracy or completeness of the indicated information. The Company has not independently verified the information provided by third-party sources. Trademarks This presentation may contain trademarks, service marks, trade names and copyrights of other companies, which are the property of the respective owners. Solely for convenience, some of the trademarks, service marks, trade names and copyrights referred to in this presentation may be listed without the TM, SM, © or ® symbols, but the Company will assert, to the fullest extent under applicable law, the rights of the applicable owners, if any, to these trademarks, service marks, trade names and copyrights.
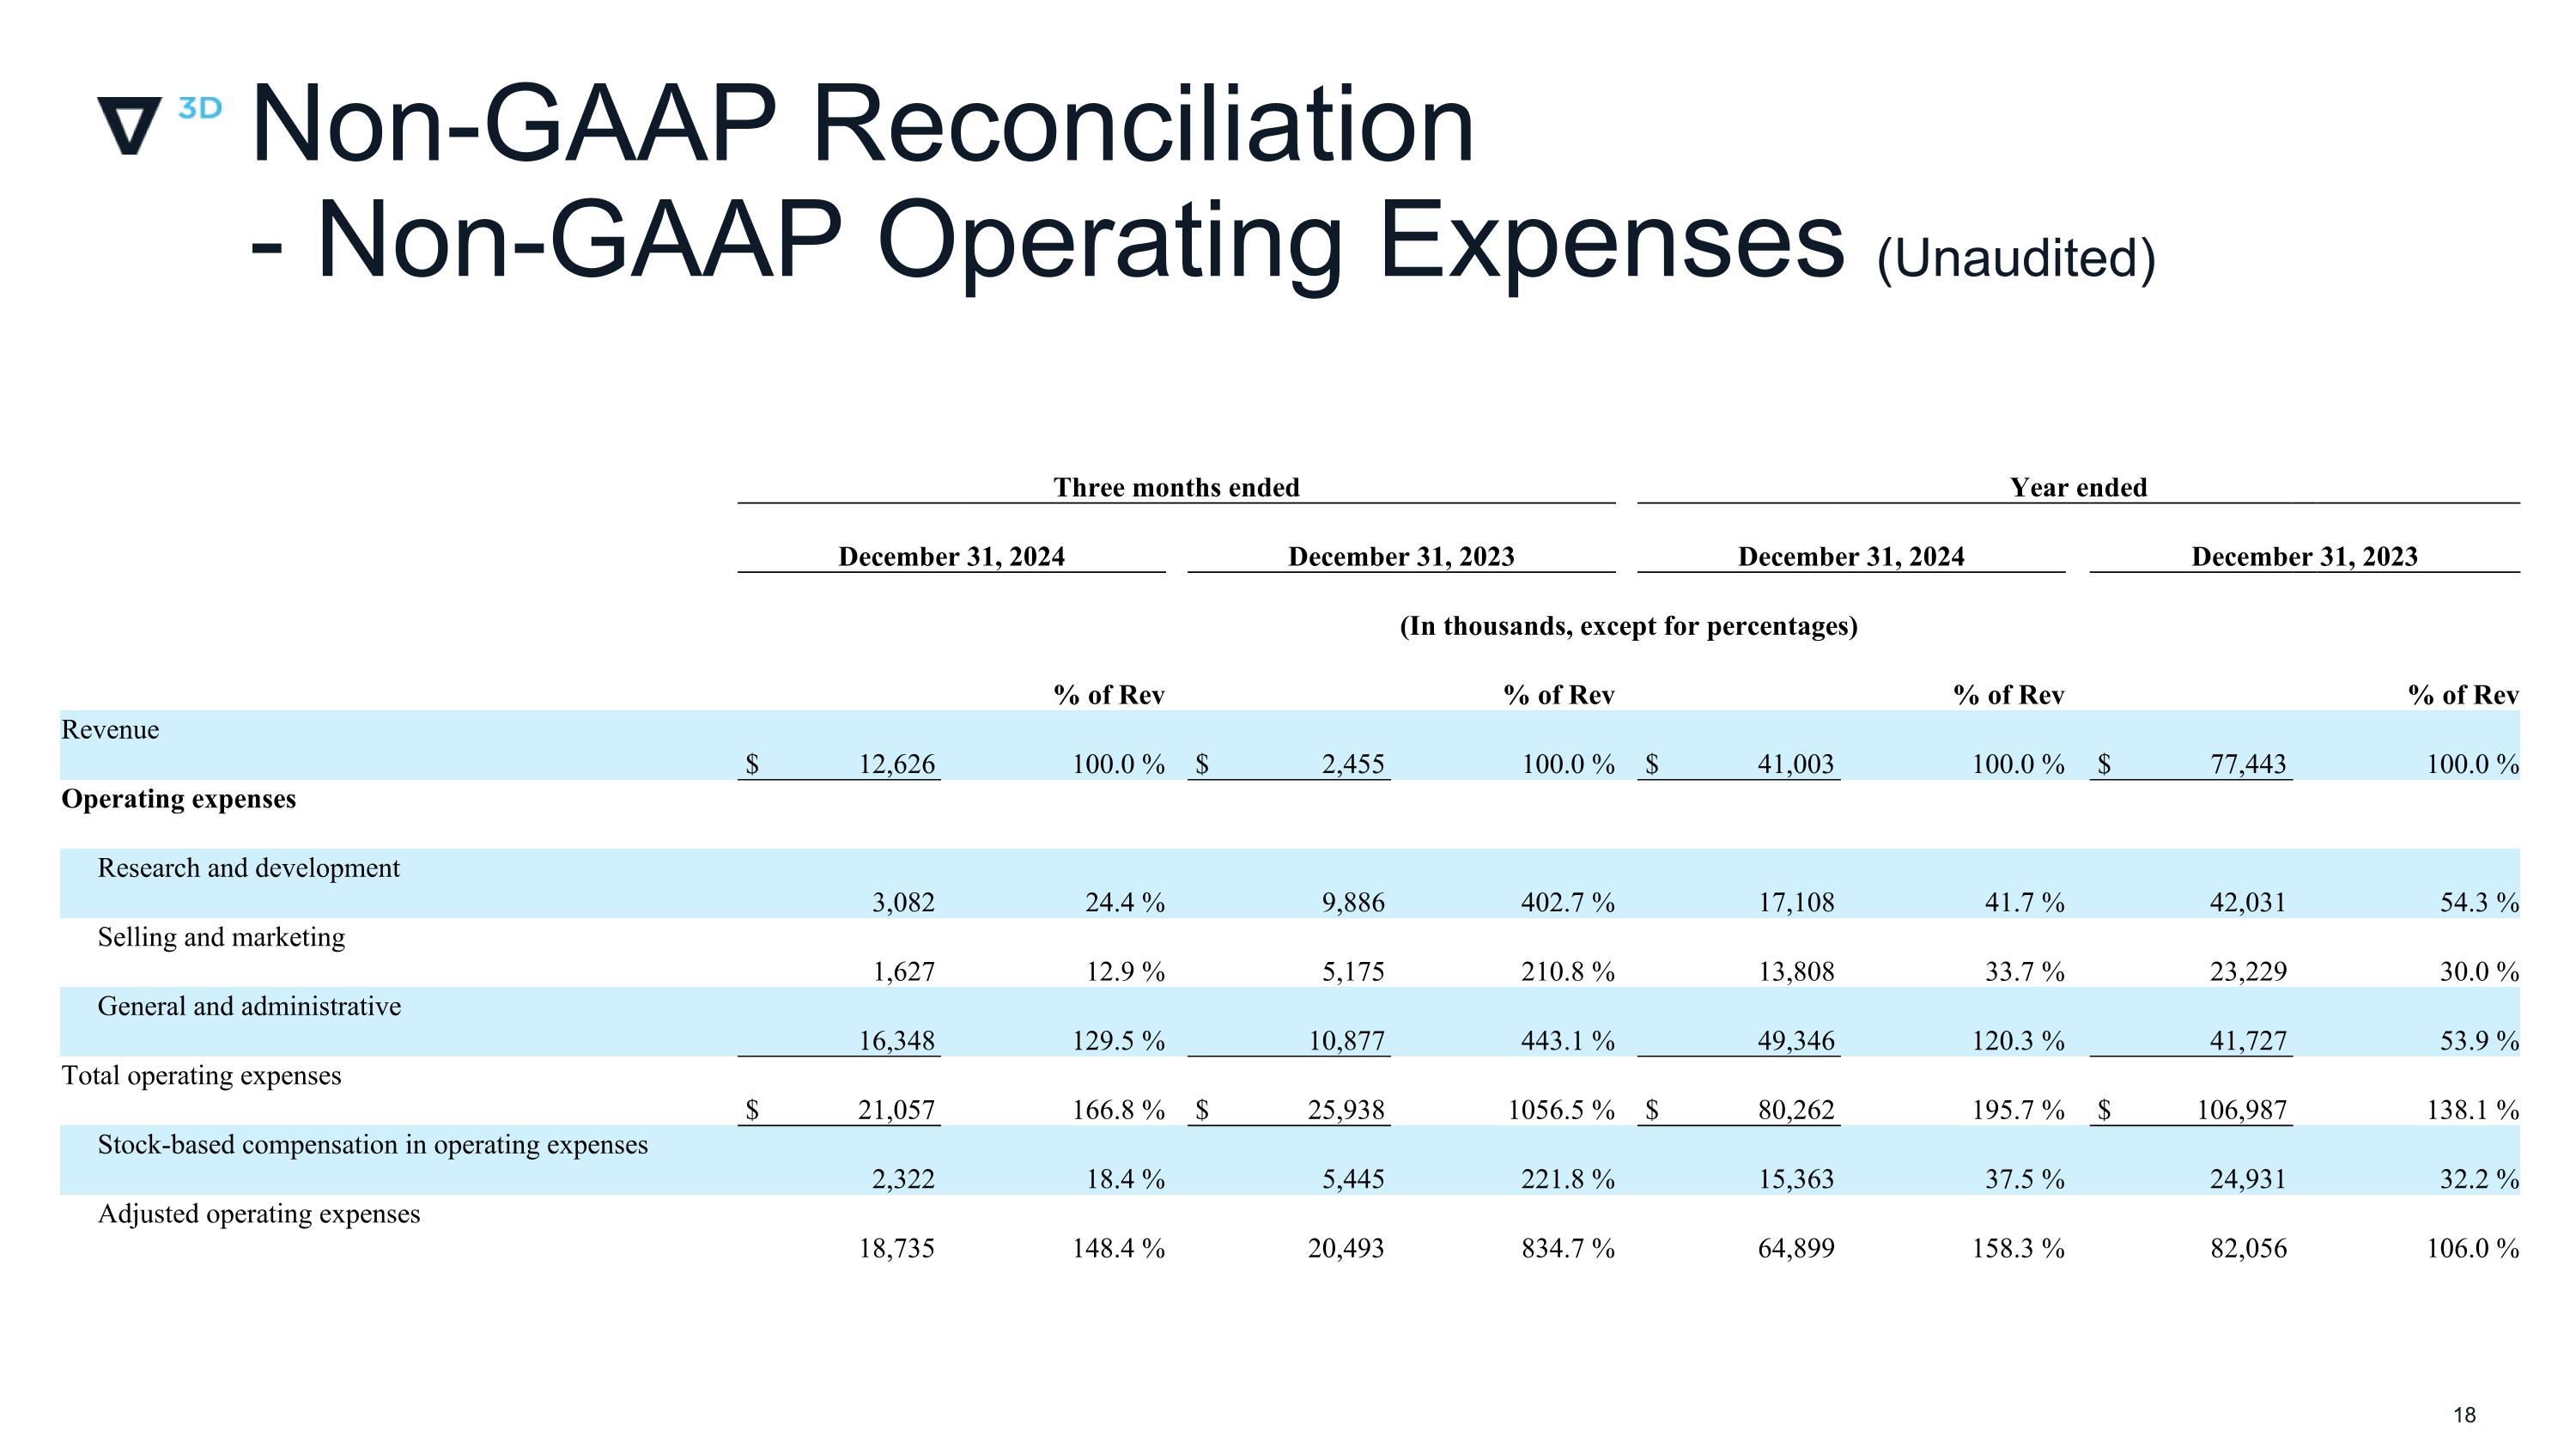
Non-GAAP Reconciliation - Non-GAAP Operating Expenses (Unaudited) Three months ended Year ended December 31, 2024 December 31, 2023 December 31, 2024 December 31, 2023 (In thousands, except for percentages) % of Rev % of Rev % of Rev % of Rev Revenue $ 12,626 100.0 % $ 2,455 100.0 % $ 41,003 100.0 % $ 77,443 100.0 % Operating expenses Research and development 3,082 24.4 % 9,886 402.7 % 17,108 41.7 % 42,031 54.3 % Selling and marketing 1,627 12.9 % 5,175 210.8 % 13,808 33.7 % 23,229 30.0 % General and administrative 16,348 129.5 % 10,877 443.1 % 49,346 120.3 % 41,727 53.9 % Total operating expenses $ 21,057 166.8 % $ 25,938 1056.5 % $ 80,262 195.7 % $ 106,987 138.1 % Stock-based compensation in operating expenses 2,322 18.4 % 5,445 221.8 % 15,363 37.5 % 24,931 32.2 % Adjusted operating expenses 18,735 148.4 % 20,493 834.7 % 64,899 158.3 % 82,056 106.0 %
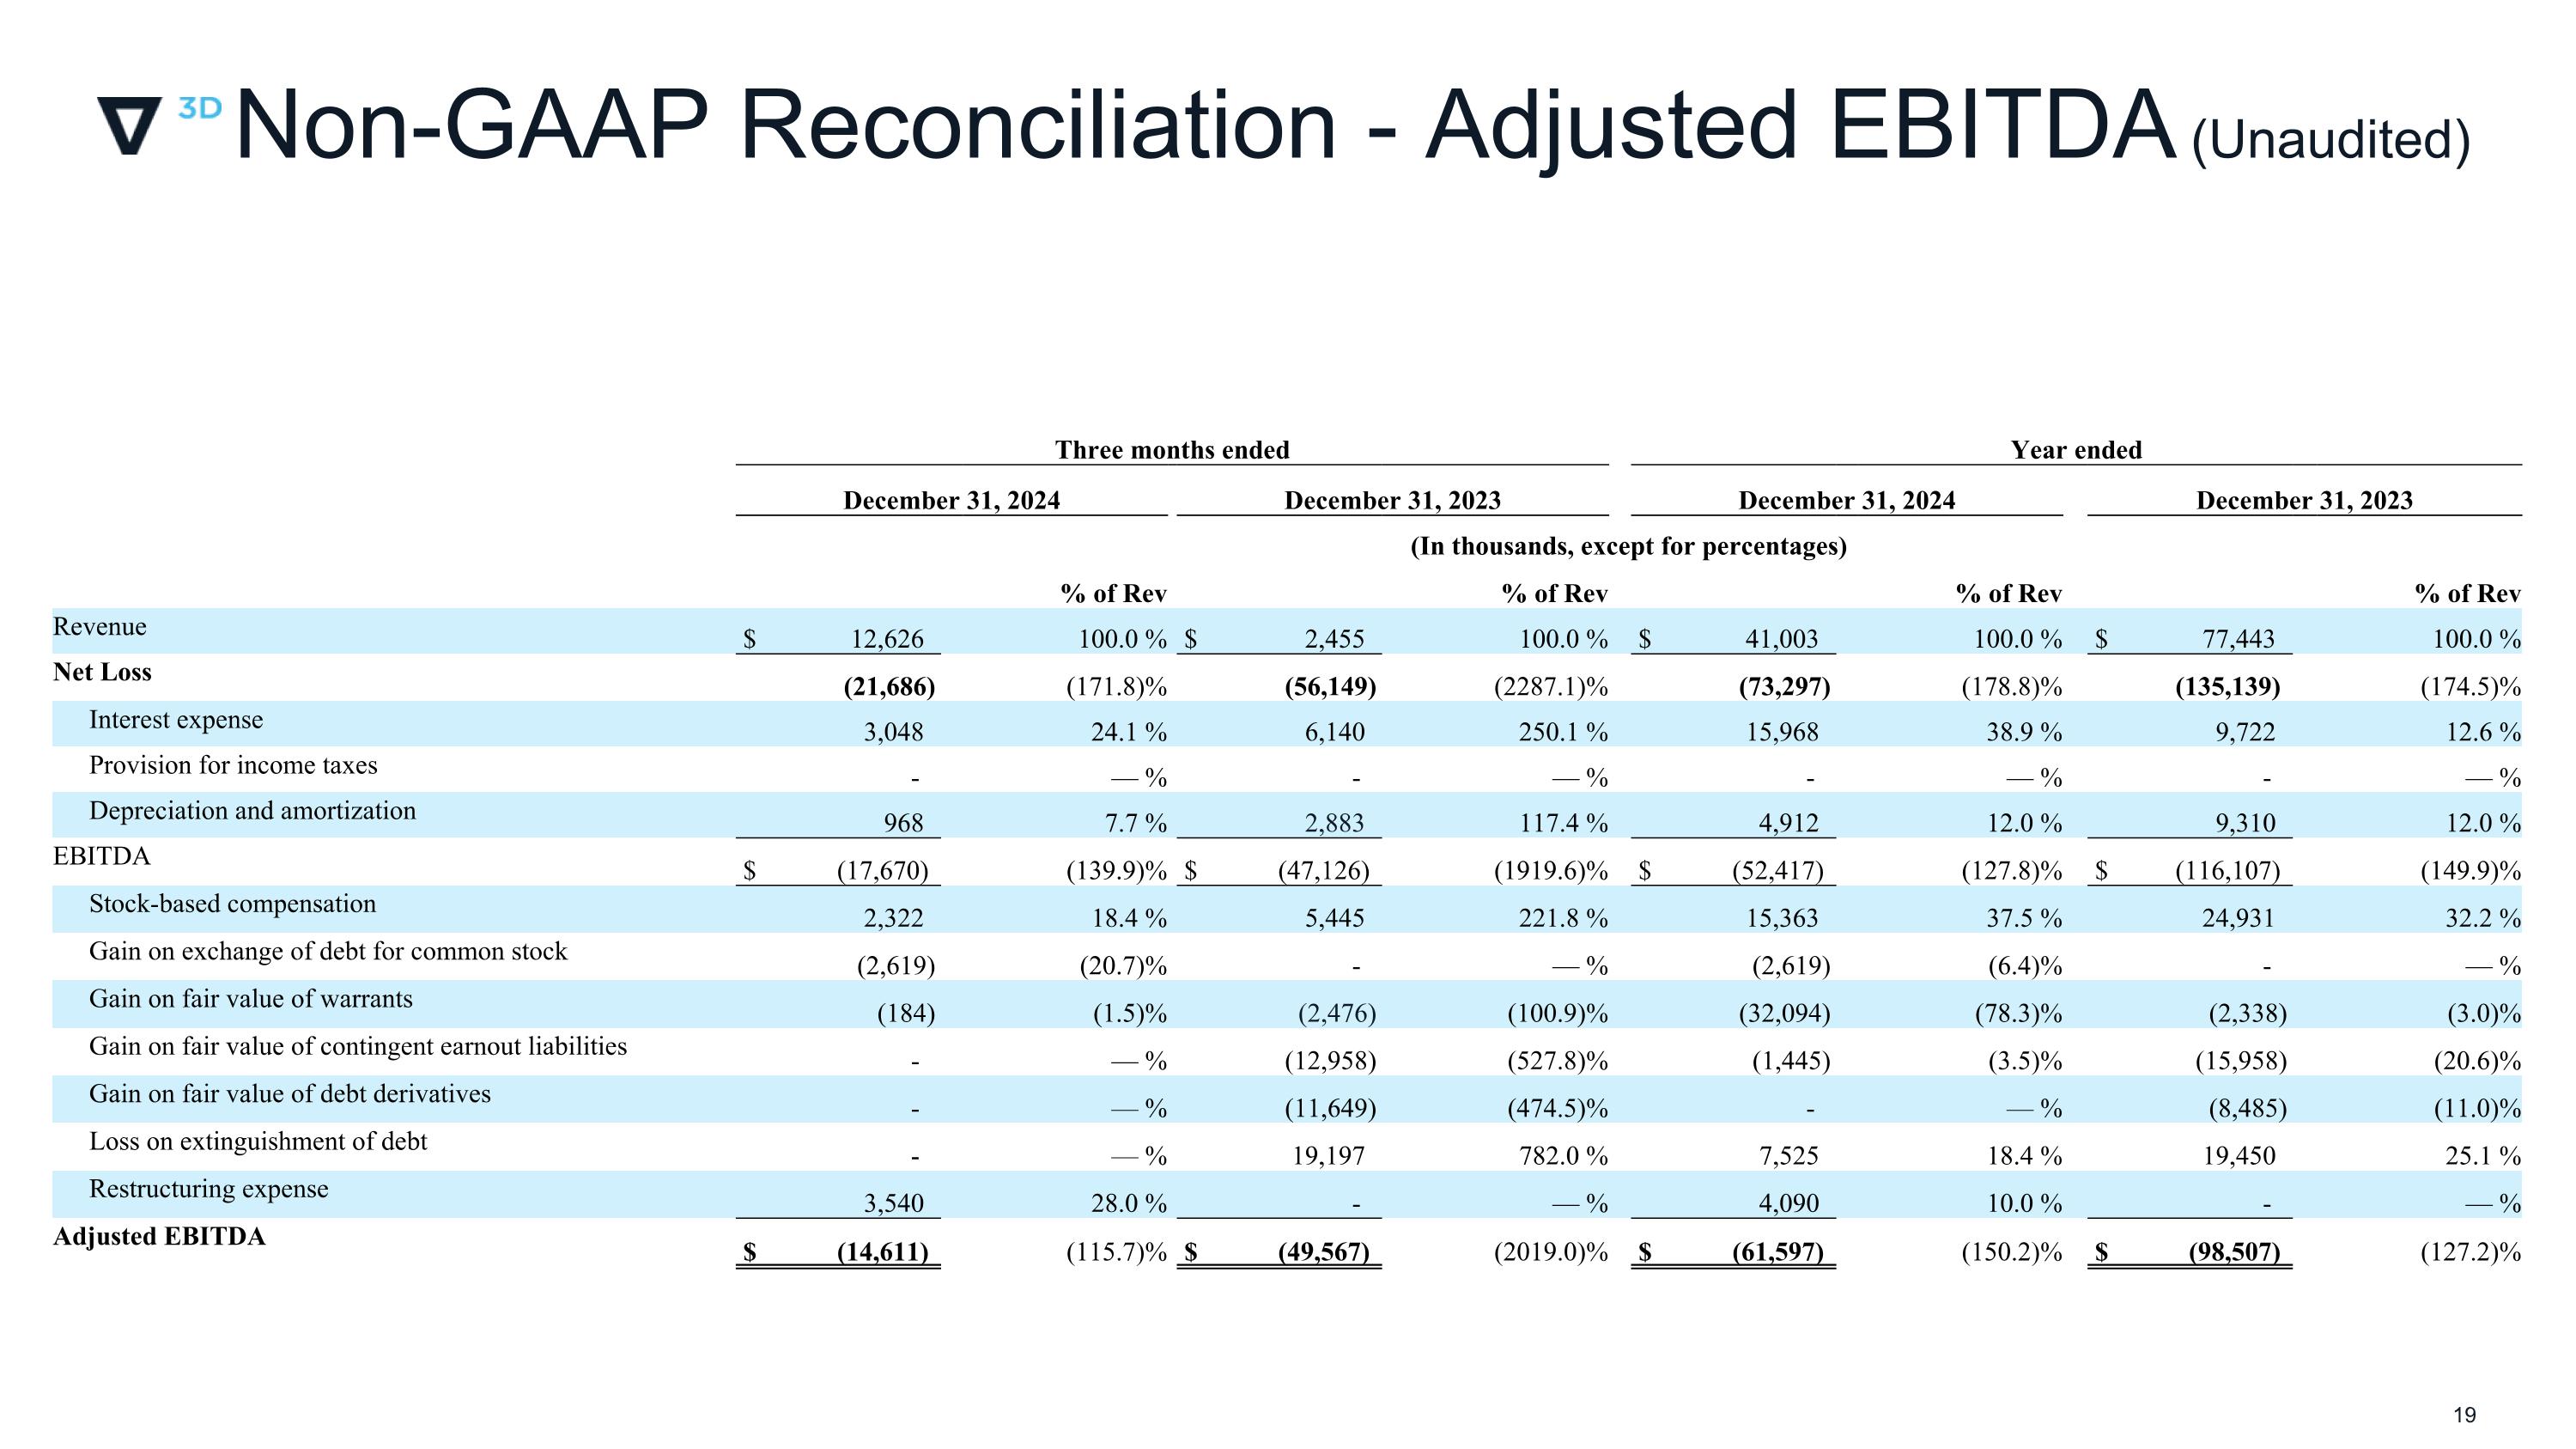
Non-GAAP Reconciliation - Adjusted EBITDA (Unaudited) Three months ended Year ended December 31, 2024 December 31, 2023 December 31, 2024 December 31, 2023 (In thousands, except for percentages) % of Rev % of Rev % of Rev % of Rev Revenue $ 12,626 100.0 % $ 2,455 100.0 % $ 41,003 100.0 % $ 77,443 100.0 % Net Loss (21,686) (171.8)% (56,149) (2287.1)% (73,297) (178.8)% (135,139) (174.5)% Interest expense 3,048 24.1 % 6,140 250.1 % 15,968 38.9 % 9,722 12.6 % Provision for income taxes - — % - — % - — % - — % Depreciation and amortization 968 7.7 % 2,883 117.4 % 4,912 12.0 % 9,310 12.0 % EBITDA $ (17,670) (139.9)% $ (47,126) (1919.6)% $ (52,417) (127.8)% $ (116,107) (149.9)% Stock-based compensation 2,322 18.4 % 5,445 221.8 % 15,363 37.5 % 24,931 32.2 % Gain on exchange of debt for common stock (2,619) (20.7)% - — % (2,619) (6.4)% - — % Gain on fair value of warrants (184) (1.5)% (2,476) (100.9)% (32,094) (78.3)% (2,338) (3.0)% Gain on fair value of contingent earnout liabilities - — % (12,958) (527.8)% (1,445) (3.5)% (15,958) (20.6)% Gain on fair value of debt derivatives - — % (11,649) (474.5)% - — % (8,485) (11.0)% Loss on extinguishment of debt - — % 19,197 782.0 % 7,525 18.4 % 19,450 25.1 % Restructuring expense 3,540 28.0 % - — % 4,090 10.0 % - — % Adjusted EBITDA $ (14,611) (115.7)% $ (49,567) (2019.0)% $ (61,597) (150.2)% $ (98,507) (127.2)%
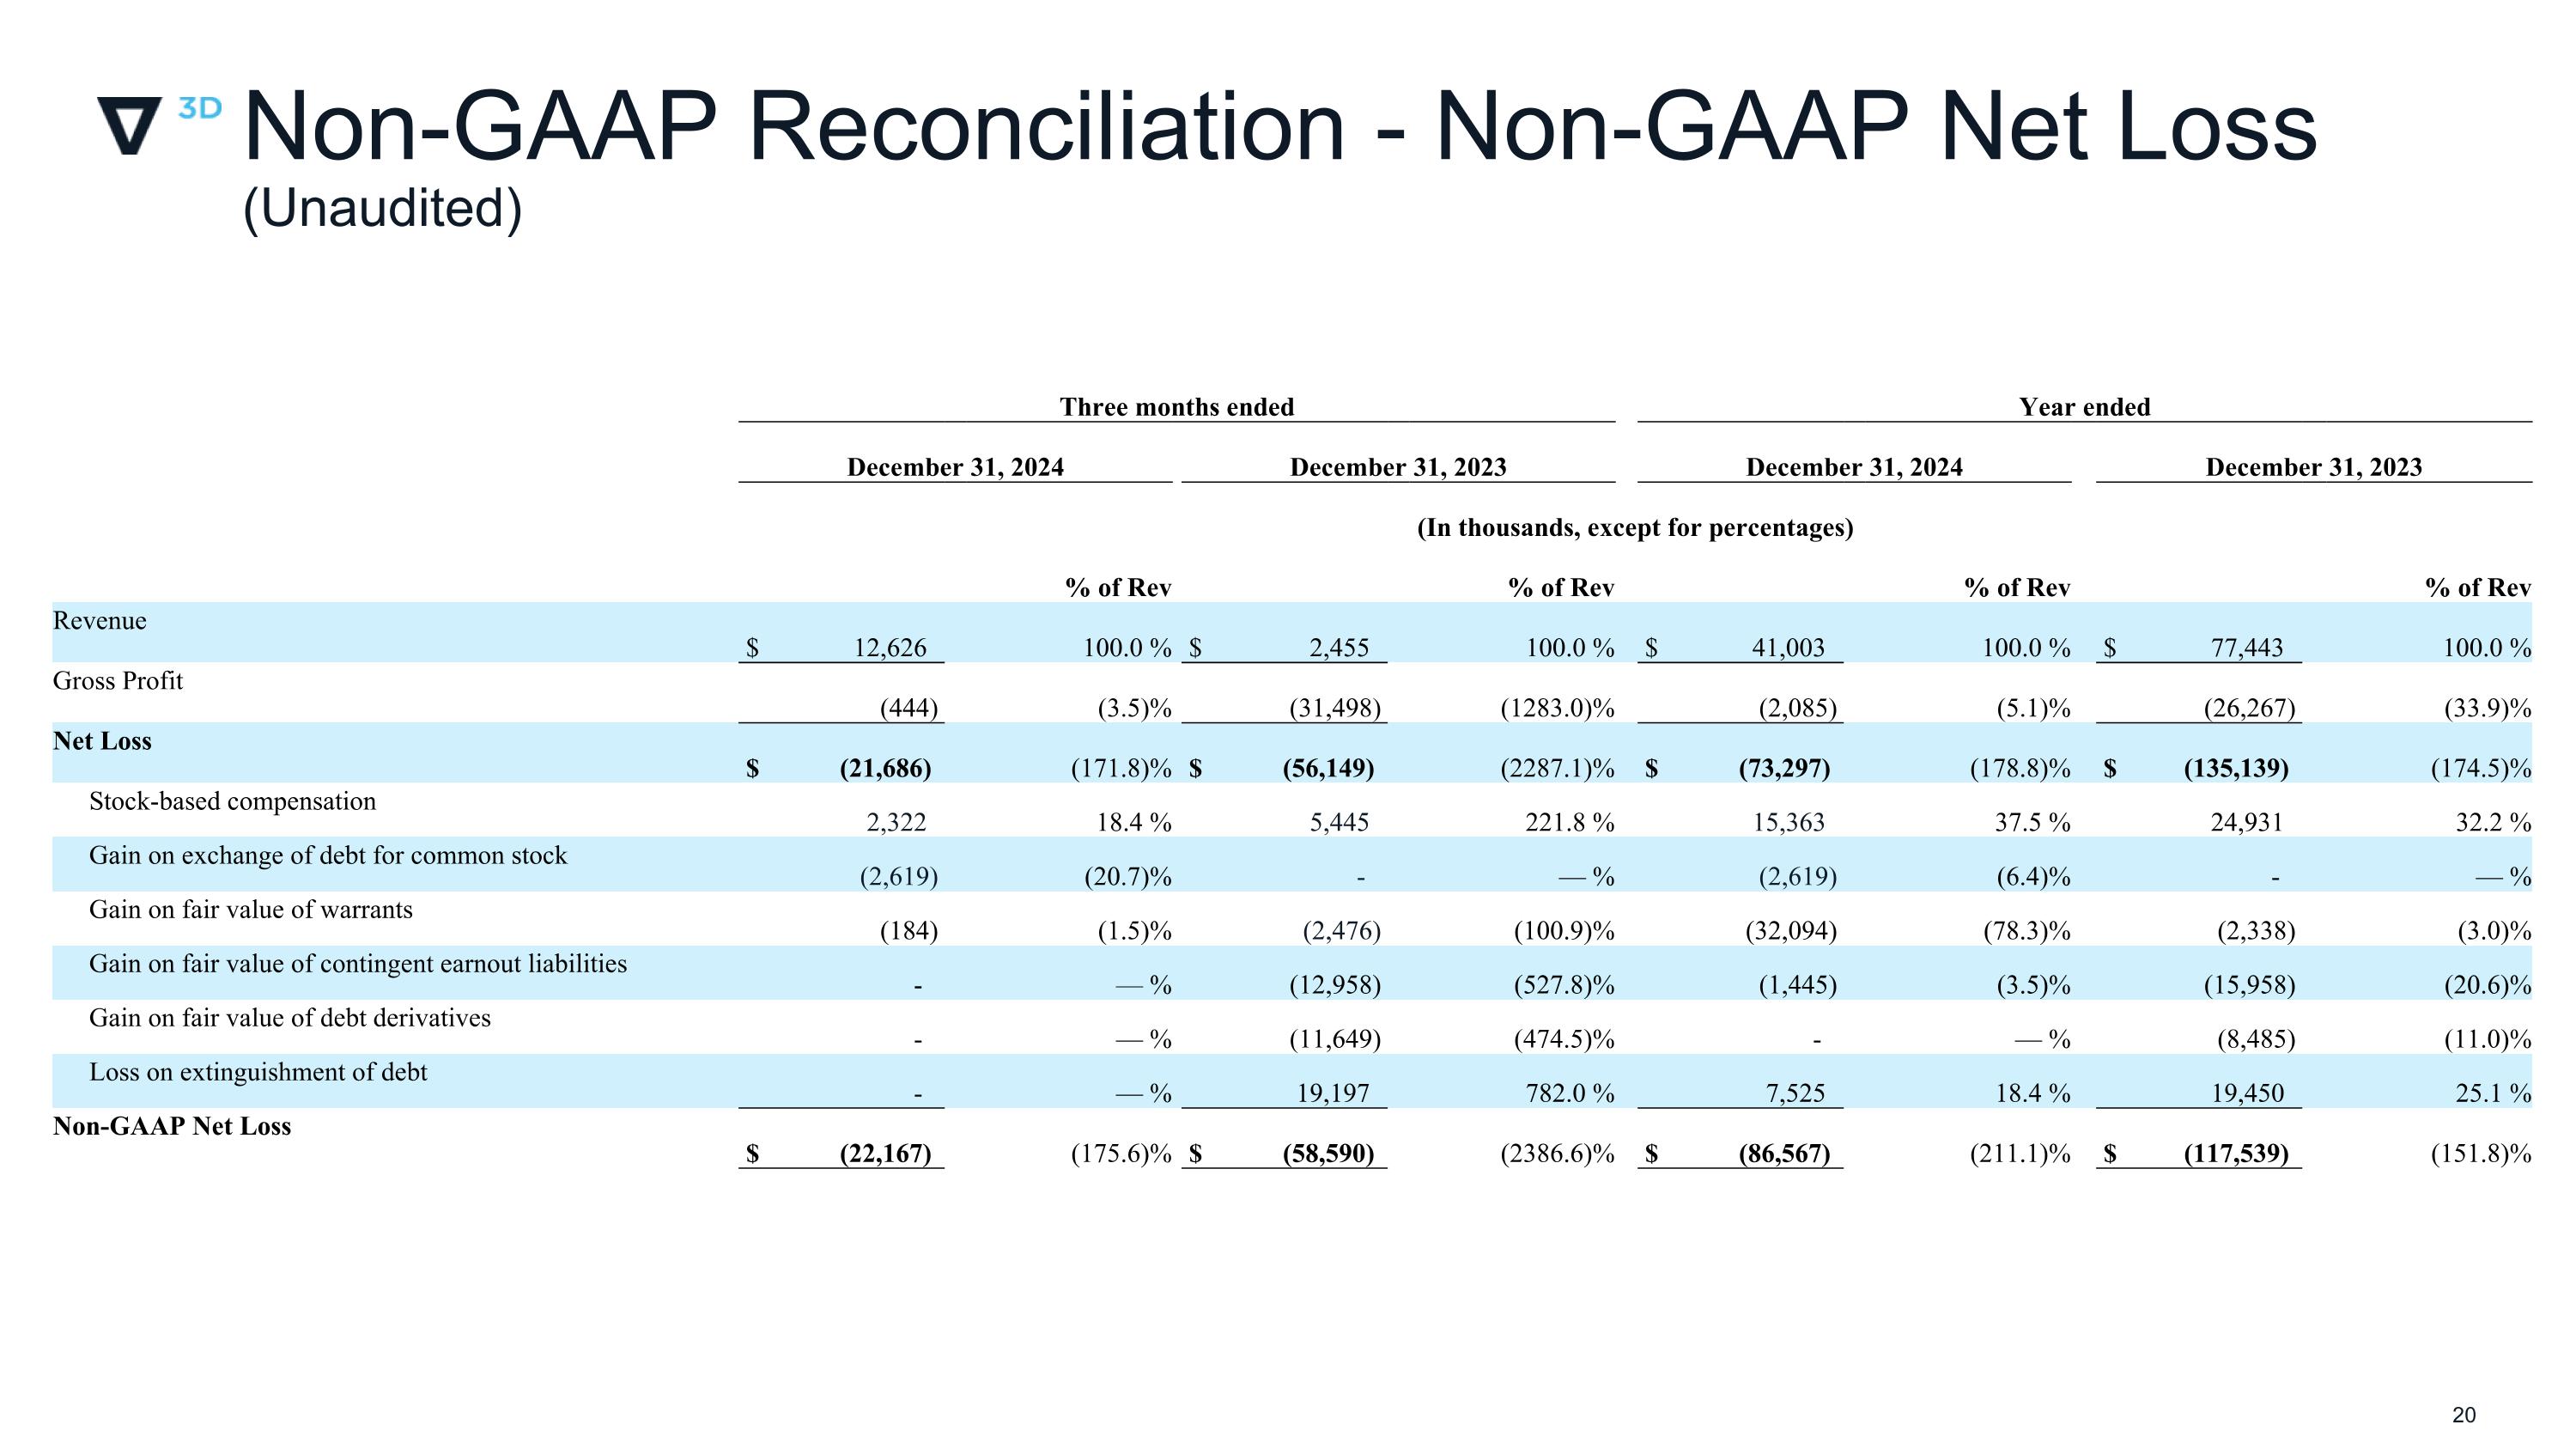
Non-GAAP Reconciliation - Non-GAAP Net Loss (Unaudited) Three months ended Year ended December 31, 2024 December 31, 2023 December 31, 2024 December 31, 2023 (In thousands, except for percentages) % of Rev % of Rev % of Rev % of Rev Revenue $ 12,626 100.0 % $ 2,455 100.0 % $ 41,003 100.0 % $ 77,443 100.0 % Gross Profit (444) (3.5)% (31,498) (1283.0)% (2,085) (5.1)% (26,267) (33.9)% Net Loss $ (21,686) (171.8)% $ (56,149) (2287.1)% $ (73,297) (178.8)% $ (135,139) (174.5)% Stock-based compensation 2,322 18.4 % 5,445 221.8 % 15,363 37.5 % 24,931 32.2 % Gain on exchange of debt for common stock (2,619) (20.7)% - — % (2,619) (6.4)% - — % Gain on fair value of warrants (184) (1.5)% (2,476) (100.9)% (32,094) (78.3)% (2,338) (3.0)% Gain on fair value of contingent earnout liabilities - — % (12,958) (527.8)% (1,445) (3.5)% (15,958) (20.6)% Gain on fair value of debt derivatives - — % (11,649) (474.5)% - — % (8,485) (11.0)% Loss on extinguishment of debt - — % 19,197 782.0 % 7,525 18.4 % 19,450 25.1 % Non-GAAP Net Loss $ (22,167) (175.6)% $ (58,590) (2386.6)% $ (86,567) (211.1)% $ (117,539) (151.8)%